ARB up 6% in 24 hours, seeks more gains
Abitrum has hit a key supply area but could surmount it if BTC remains bullish in the short term.

Disclaimer: The information presented does not constitute financial, investment, trading, or other types of advice and is solely the writer’s opinion.
- The H4 market structure was bullish after ARB climbed $1.15.
- The Open Interest (OI) rates increased, but buying volumes eased.
Most altcoins have been in tight price consolidation following Bitcoin’s [BTC] fluctuations below $31k since 24 June. However, Arbitrum [ARB] broke from the range formation spell and inflicted a bullish breakout, hiking about 6% in the past 24 hours as of press time.
Is your portfolio green? Check out the ARB Profit Calculator
But the price action must clear the supply area near $1.25 for bulls to seek extra gains. In the meantime, BTC was still defending the $30k zone and traded at $30.5k at the time of writing.
Can bulls clear the $1.3 hurdle?
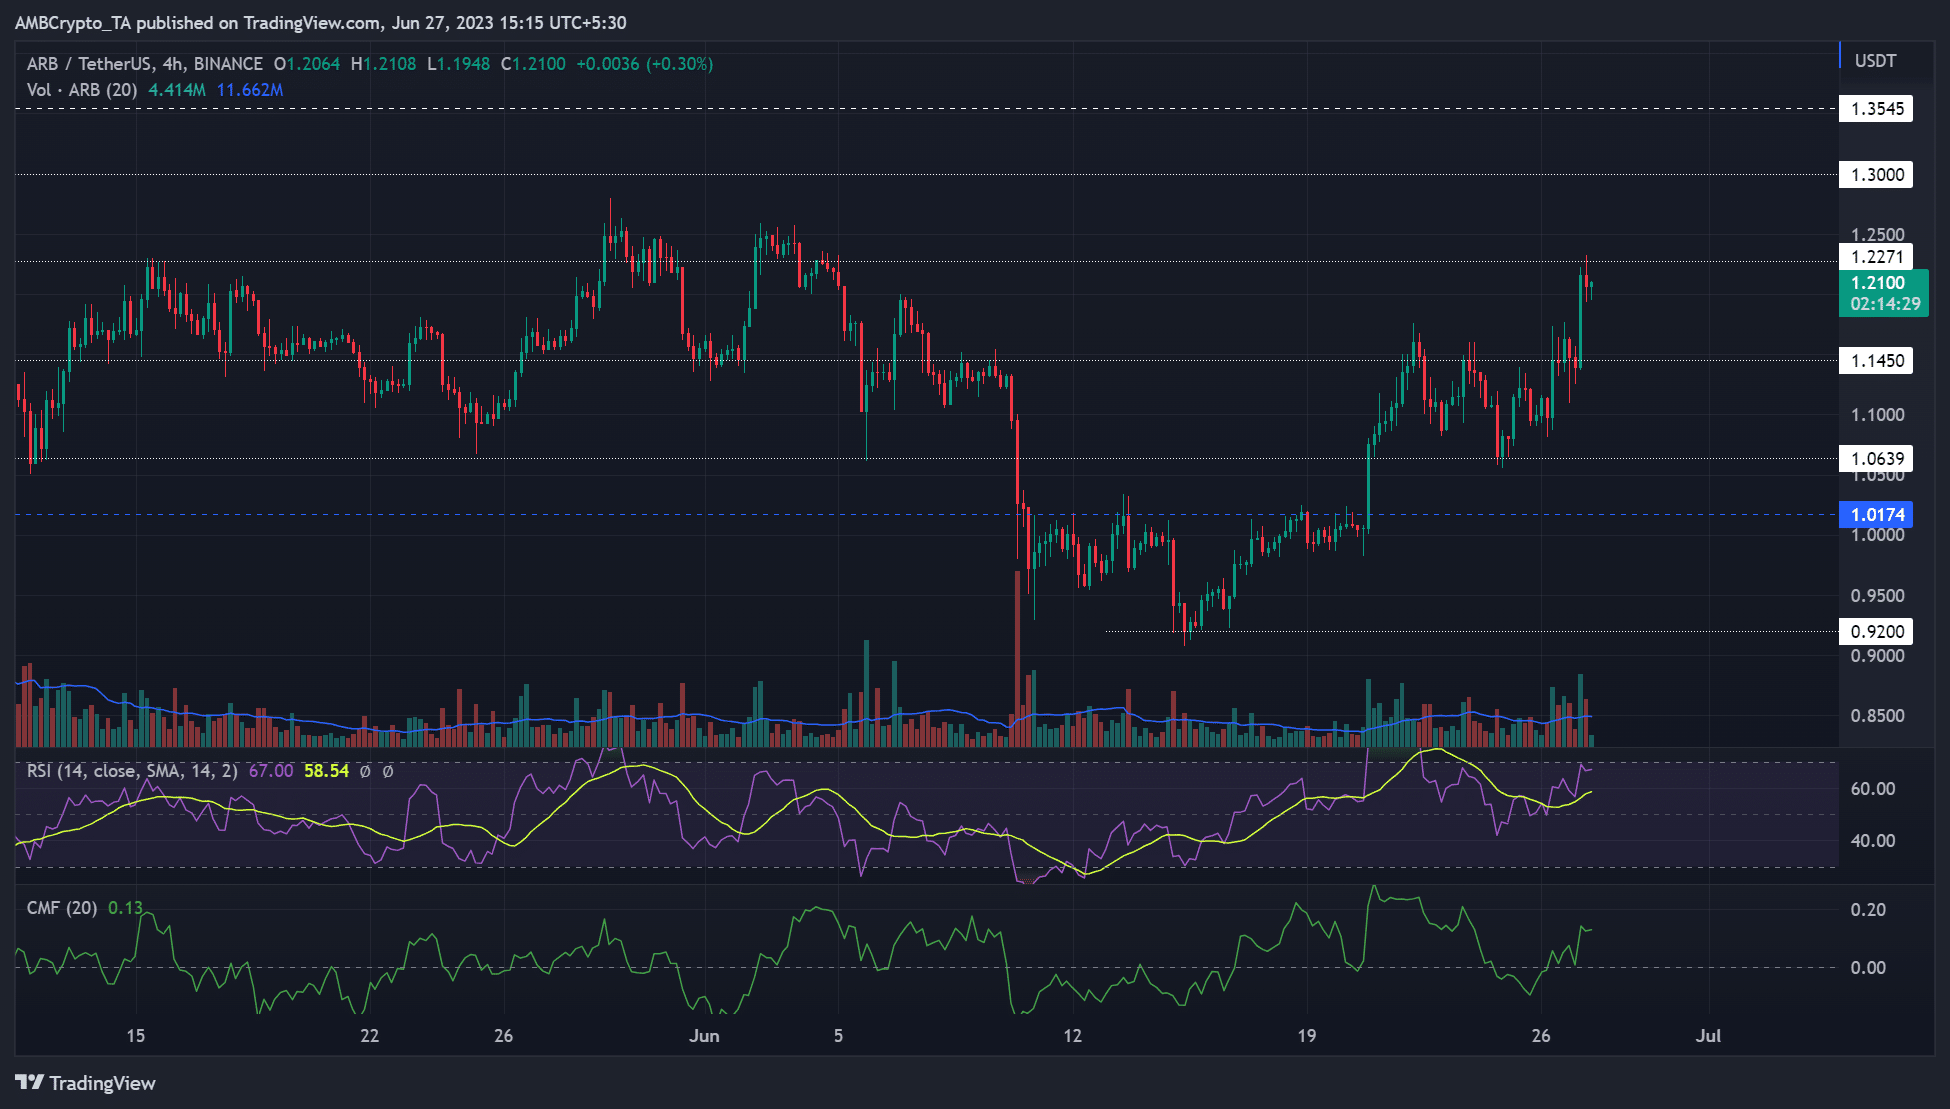
A look at the technical indicators on the 4-hour chart suggested a bullish bias as of press time. The CMF (Chaikin Money Flow) has sharply crossed above the zero mark, denoting increased capital inflows.
Similarly, the RSI (Relative Strength Index) hit the overbought zone, indicating buying pressure increased at the time of writing.
With a bullish BTC firmly above $30k, ARB could attempt to clear the supply area and hurdle near $1.25. A session close above $1.25 could make a $1.30 and $1.36 reclaim feasible.
Alternatively, a price rejection at the $1.25 supply area could set ARB to retest the immediate short-term support of $1.145. So, a breakout retest on the $1.25 supply or rebound from $1.145 support could signal buying signals.
A drop below $1.145 will weaken the structure, dropping ARB below a recent higher low and flipping H4 to bearish.
Buying volumes eased; Open Interest rates increased

On the 1-hour chart, the CVD (Cumulative Volume Delta) spiked around 20-21 June but declined afterwards. It shows buying volumes eased tremendously after 21 June.
How much are 1,10,100 ARBs worth today?
Similarly, the Open Interest (OI) rates, which track demand in the futures market, declined below $150 million between 22 – 26 June but surged afterwards, hitting $180 million as of press time.
That’s a bullish cue, but traders should track worrisome buying volumes and BTC price action before making moves.


