
- LINK’s supply on exchanges declined while its supply outside of exchanges increased.
- Market sentiment around LINK, however, continued to remain negative.
Chainlink [LINK] has been facing heat from the bearish market as its price sank considerably last week. However, during the same period, whales began accumulation. The effects of the whales’ action were reflected on LINK’s price chart as it registered gains.
Realistic or not, here’s LINK’s market cap in BTC terms
Whale accumulation surges
Santiment’s tweet pointed out an interesting development which suggested that the big players in the crypto space took advantage of the dip. The number of Chainlink whale transactions hit a 2023 high as prices fell to a 3-year low of $5.00 this weekend.
As per the tweet, mid-sized wallets holding 1,000–100,000 LINK were seen accumulating large amounts. Around 3.9 million LINK tokens, worth $20 million, were accumulated in the past week alone.
? The amount of #Chainlink whale transactions has hit a 2023 high as prices fell to a 3-year low $5.00 this weekend. Mid-sized 1K-100K $LINK wallets are particularly accumulating big, with 3.9M $LINK (worth $20.0M) accumulated in the past week. https://t.co/pY7fezqxJP pic.twitter.com/K3P5EXoKeO
— Santiment (@santimentfeed) June 13, 2023
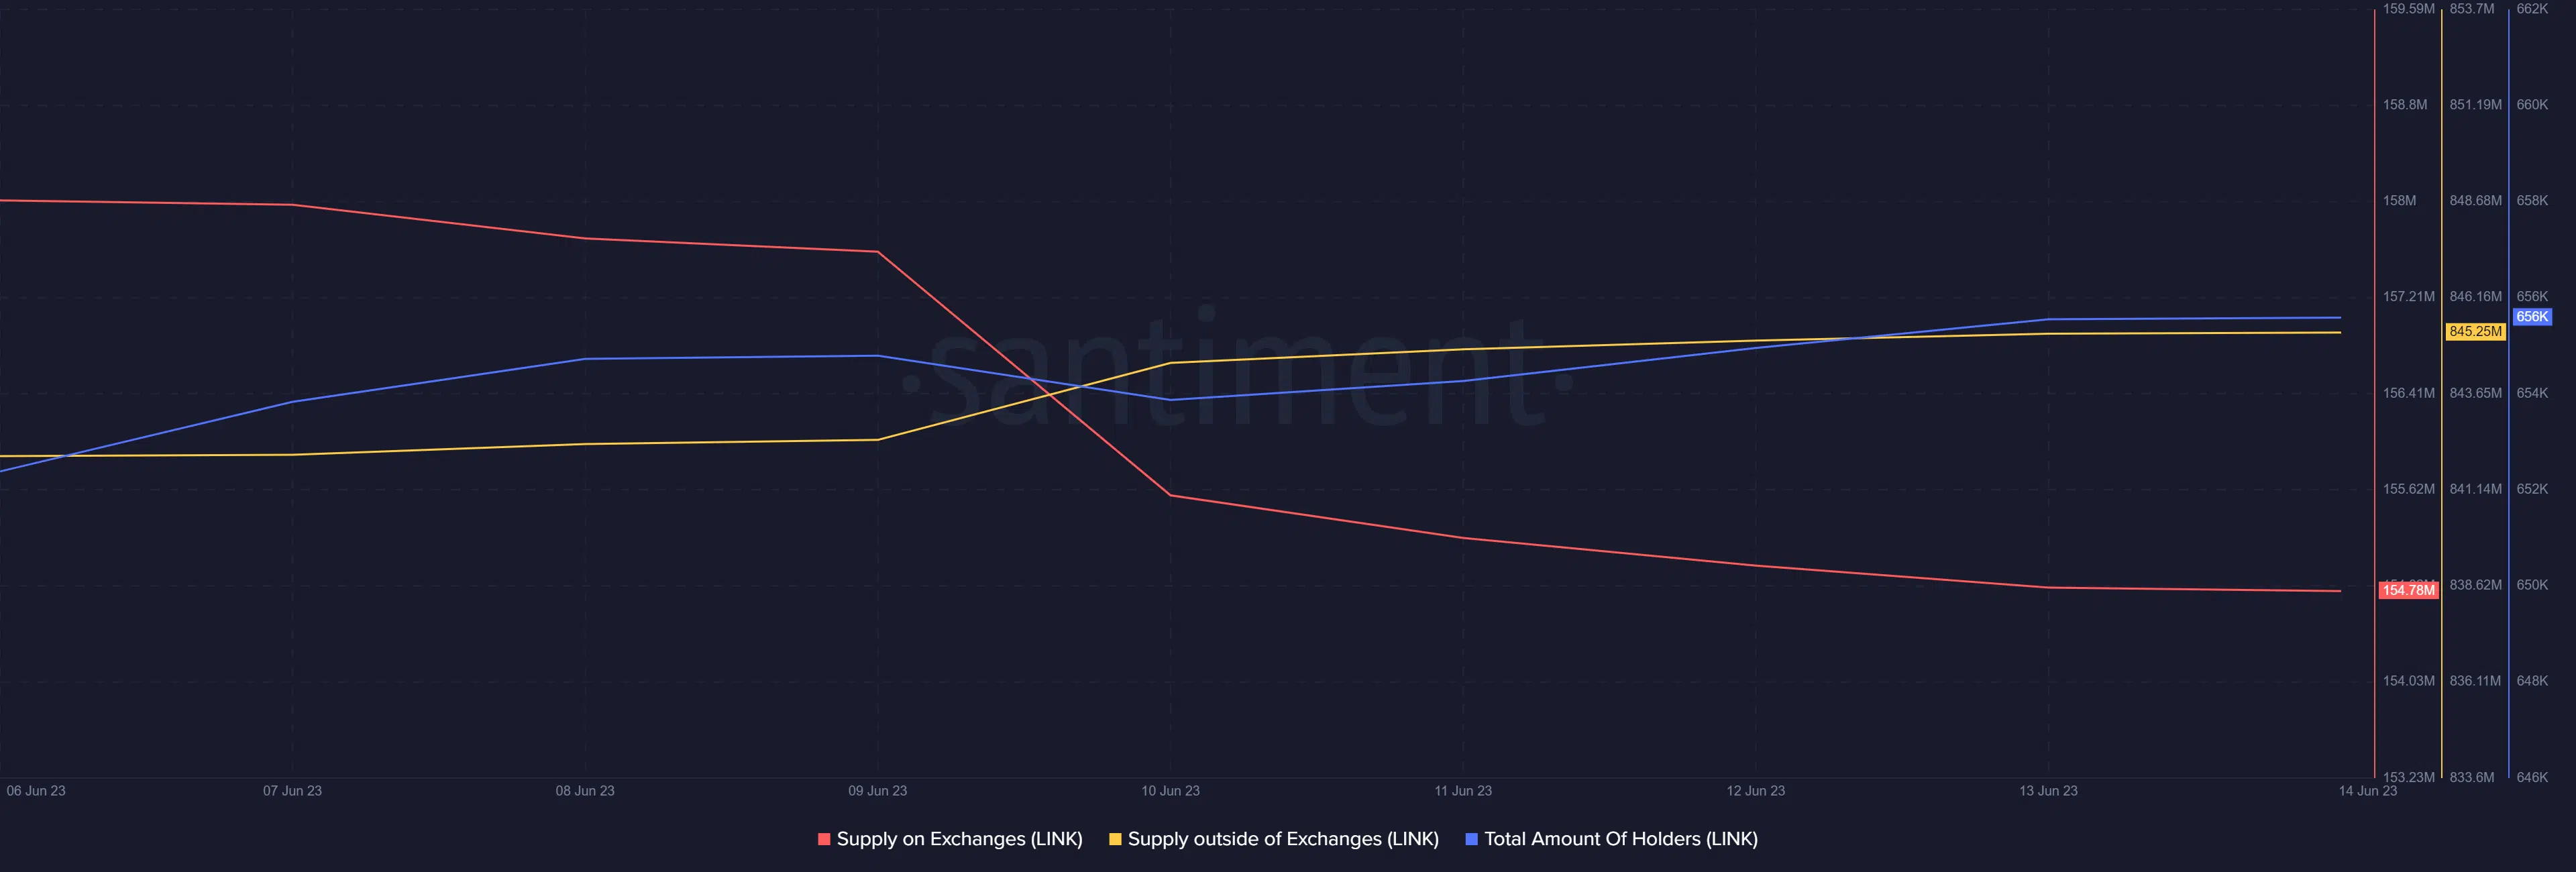
A similar accumulation trend was also plotted on Santiment’s chart. As per the data, Chainlink’s supply on exchanges went down. This was accompanied by an increase in its supply outside of exchanges, which is bullish.
Moreover, the total number of LINK holders also went up slightly, reflecting investors’ confidence in the token.
Source: Santiment
Chainlink recovering fast
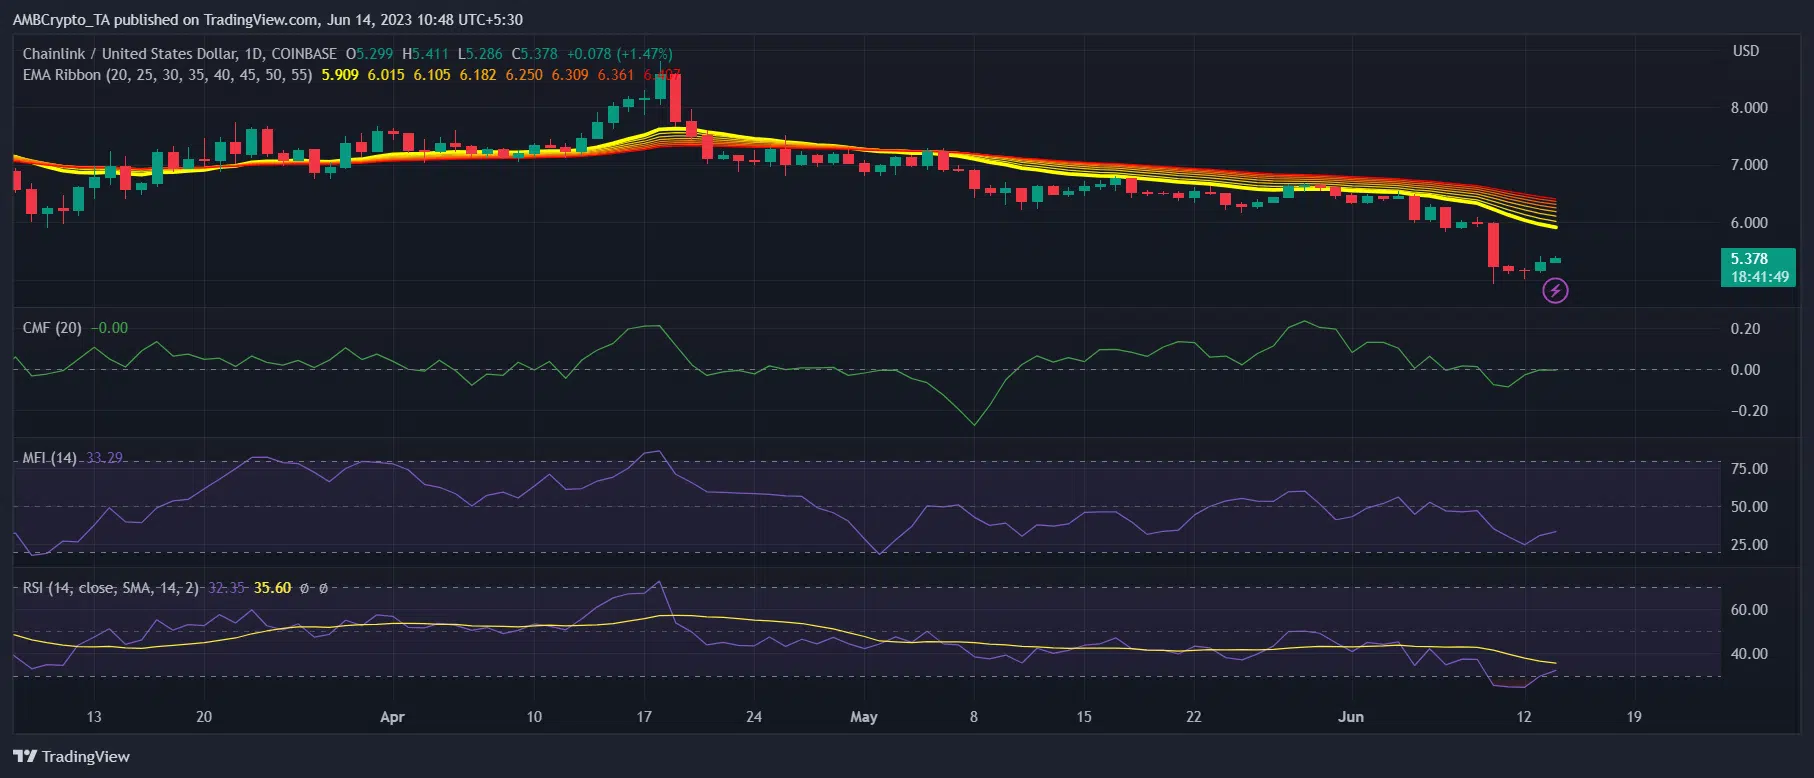
The whale activity soon showed its impact on LINK’s price chart, as its value increased by more than 3% in the last 24 hours. As per CoinMarketCap, at the time of writing, LINK was trading at $5.38 with a market capitalization of over $2.7 billion.
A look at LINK’s daily chart revealed quite a few bullish market indicators as well. For instance, Chainlink’s Money Flow Index (MFI) registered an uptick. Its Chaikin Money Flow (CMF) also followed the same trend, increasing the chances of a continued price surge.
LINK’s Relative Strength Index (RSI) also went up from the oversold zone, which was a bullish signal. However, the Exponential Moving Average (EMA) Ribbon displayed a bearish advantage.
Source: TradingView
What metrics suggest
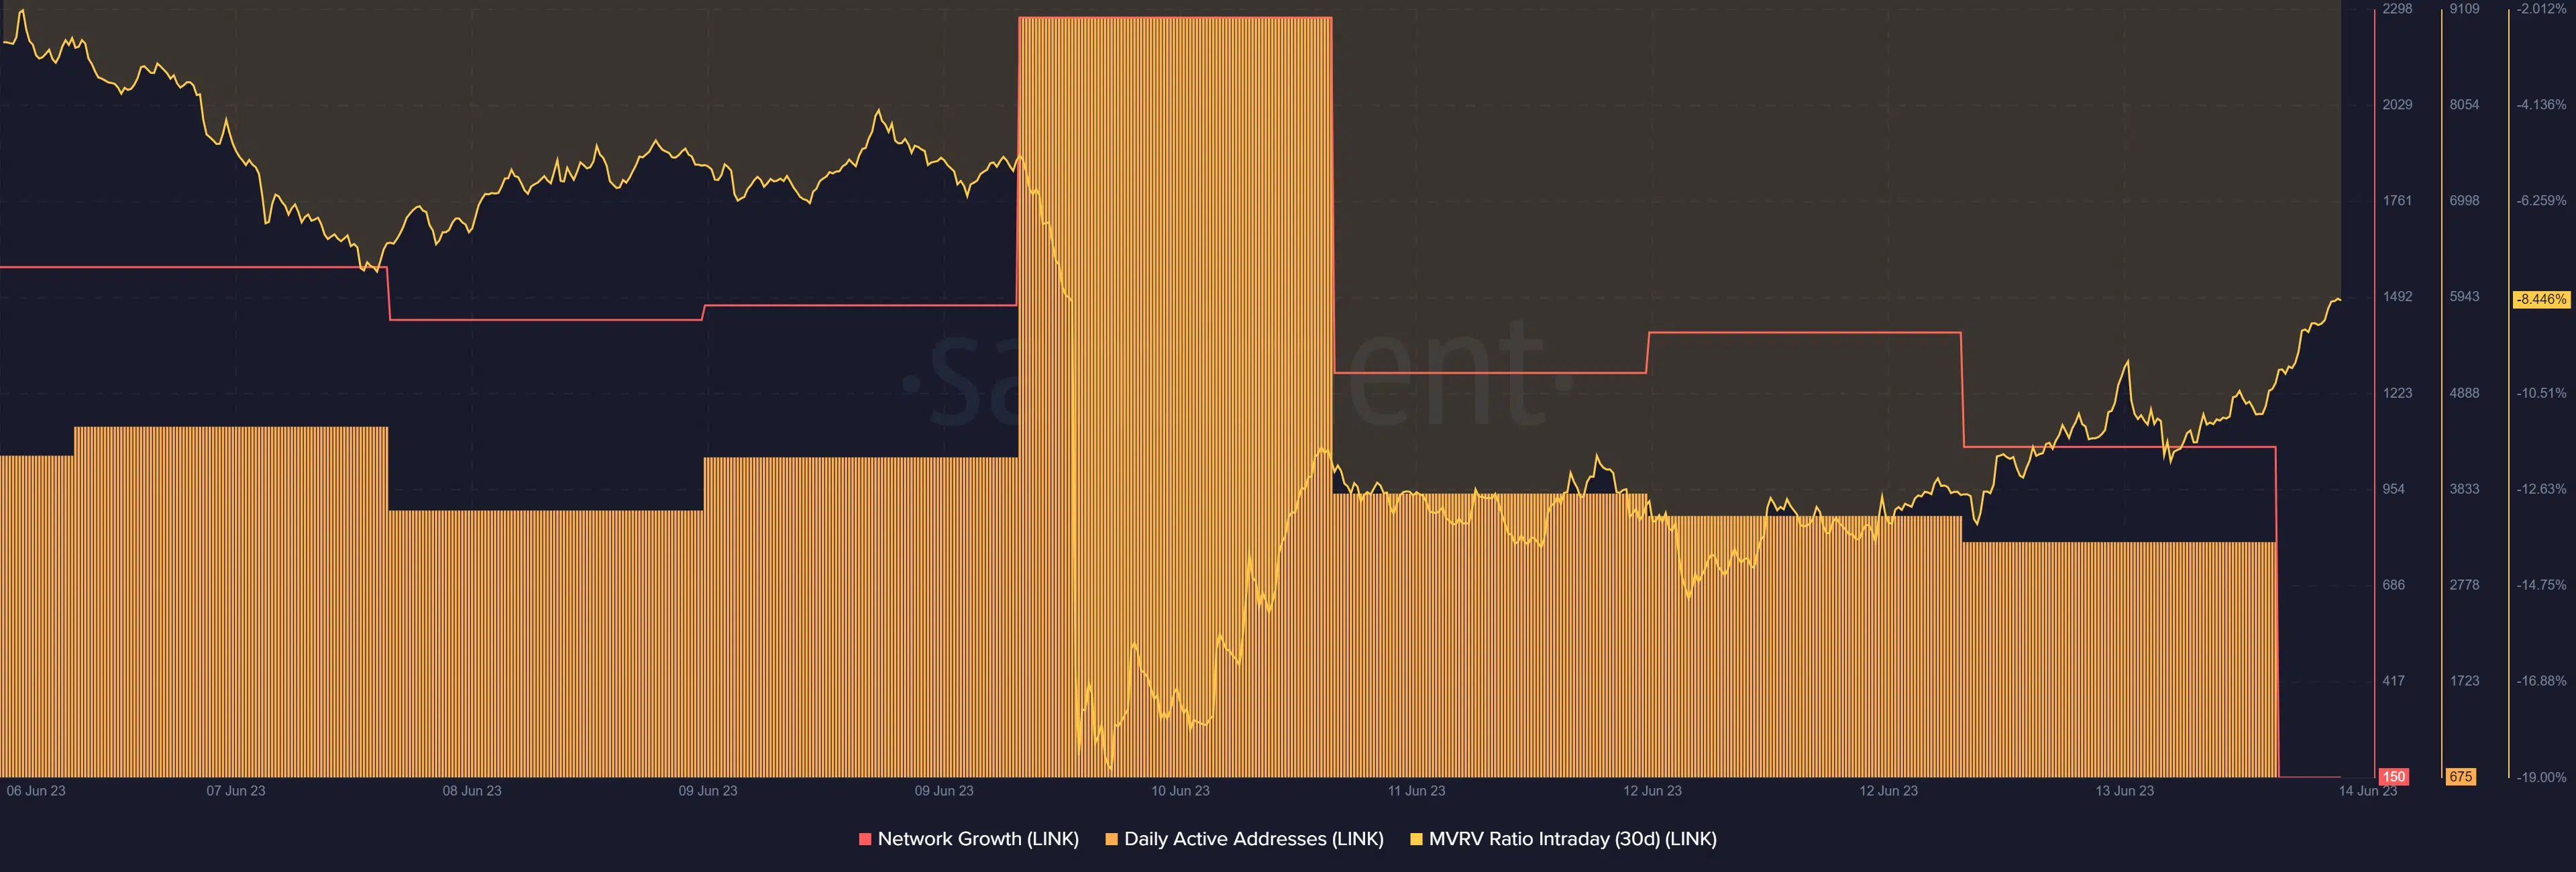
Though the EMA Ribbon was bearish on LINK, its on-chain performance looked promising. Chainlink’s daily active addresses spiked last week, which was accompanied by a rise in its network growth. Additionally, LINK’s MVRV Ratio showed signs of recovery as evident from the uptick, which was a bullish sign.
Source: Santiment
How much are 1,10,100 LINKs worth today
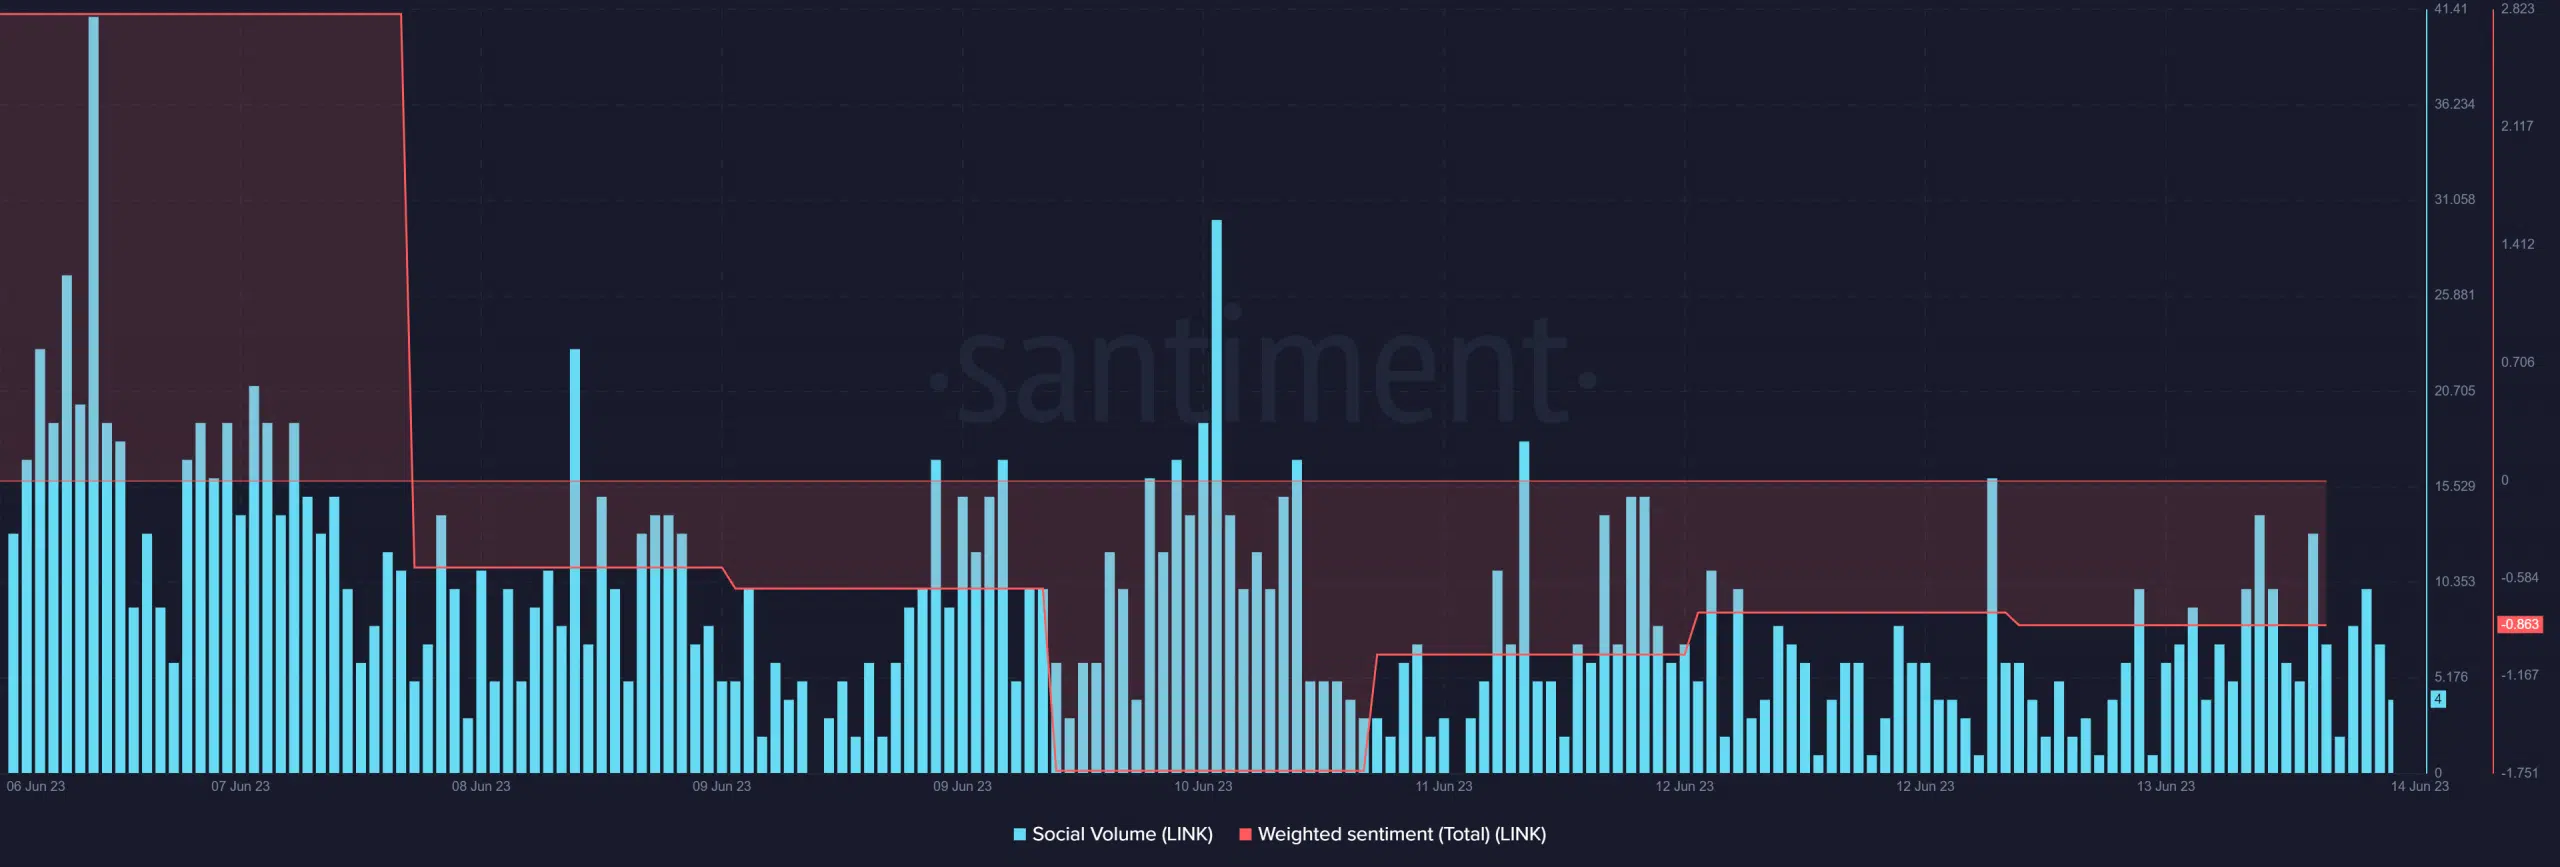
However, market sentiment around LINK remained negative. Santiment’s chart revealed that LINK’s weighted sentiment drifted toward the negative side. Not only that, but LINK’s popularity also took a blow as its social volume plummeted sharply last week.
Source: Santiment