Are Polkadot traders standing on thin ice given DOT’s ongoing price action

- Polkadot nabbed the first spot on the list of cryptocurrencies in terms of monthly revenue
- However, the metrics and indicators suggested that the investors might have to strive more for profits
Polkadot [DOT] stood bright in the spotlight once again, however, this time not for its development activity but for its revenue performance. As per Token Terminal, Polkadot topped the list of blockchains in terms of revenue generated on 11 December, as DOT’s monthly revenue increased by nearly 36%.
Polkadot is at the #1 rank in terms of revenue performance. What an impressive state 🚀
Moreover, only 4 out of 10 chains had a positive growth rate. For more details see closer below 👇🏻#polkadot #DOT $DOT #BNB #ETH #OP #FTM pic.twitter.com/Z1sQ1OUtCw
— Polkadot Insider 🐂⭕️ (@PolkadotInsider) December 11, 2022
However, despite this rise, DOT’s investors could not celebrate for long as its price declined drastically over the last week. CoinMarketCap’s data revealed that DOT was down by 10% over the past seven days.
At press time, it was trading at $5.13, with a market capitalization of over $5.8 billion.
Read Polkadot’s [DOT] Price Prediction 2023-2024
The winter might worsen
DOT managed to maintain its popularity in the crypto space, as it was on the list of most-searched cryptos on LunarCrush. Though DOT remained popular, the winter days might extend further, as suggested by the blockchain’s on-chain metrics.
There're insights in what others are searching – check out the Top 10 LunarCrush searches. #LunarCrush
1️⃣ $btc
2️⃣ $bnb
3️⃣ $eth
4️⃣ $lunr
5️⃣ $atom
6️⃣ $quack
7️⃣ $ada
8️⃣ $vra
9️⃣ $doge
🔟 $dothttps://t.co/L7I5zPUM0U— LunarCrush_Devs (@LunarCrushDevs) December 11, 2022
For instance, DOT’s positive sentiment declined sharply, after registering a spike. This indicated the investors’ dwindling confidence in the token. LunarCrush’s data further revealed that DOT’s volatility also went up considerably over the last week, further increasing the chances of a continued downtrend.
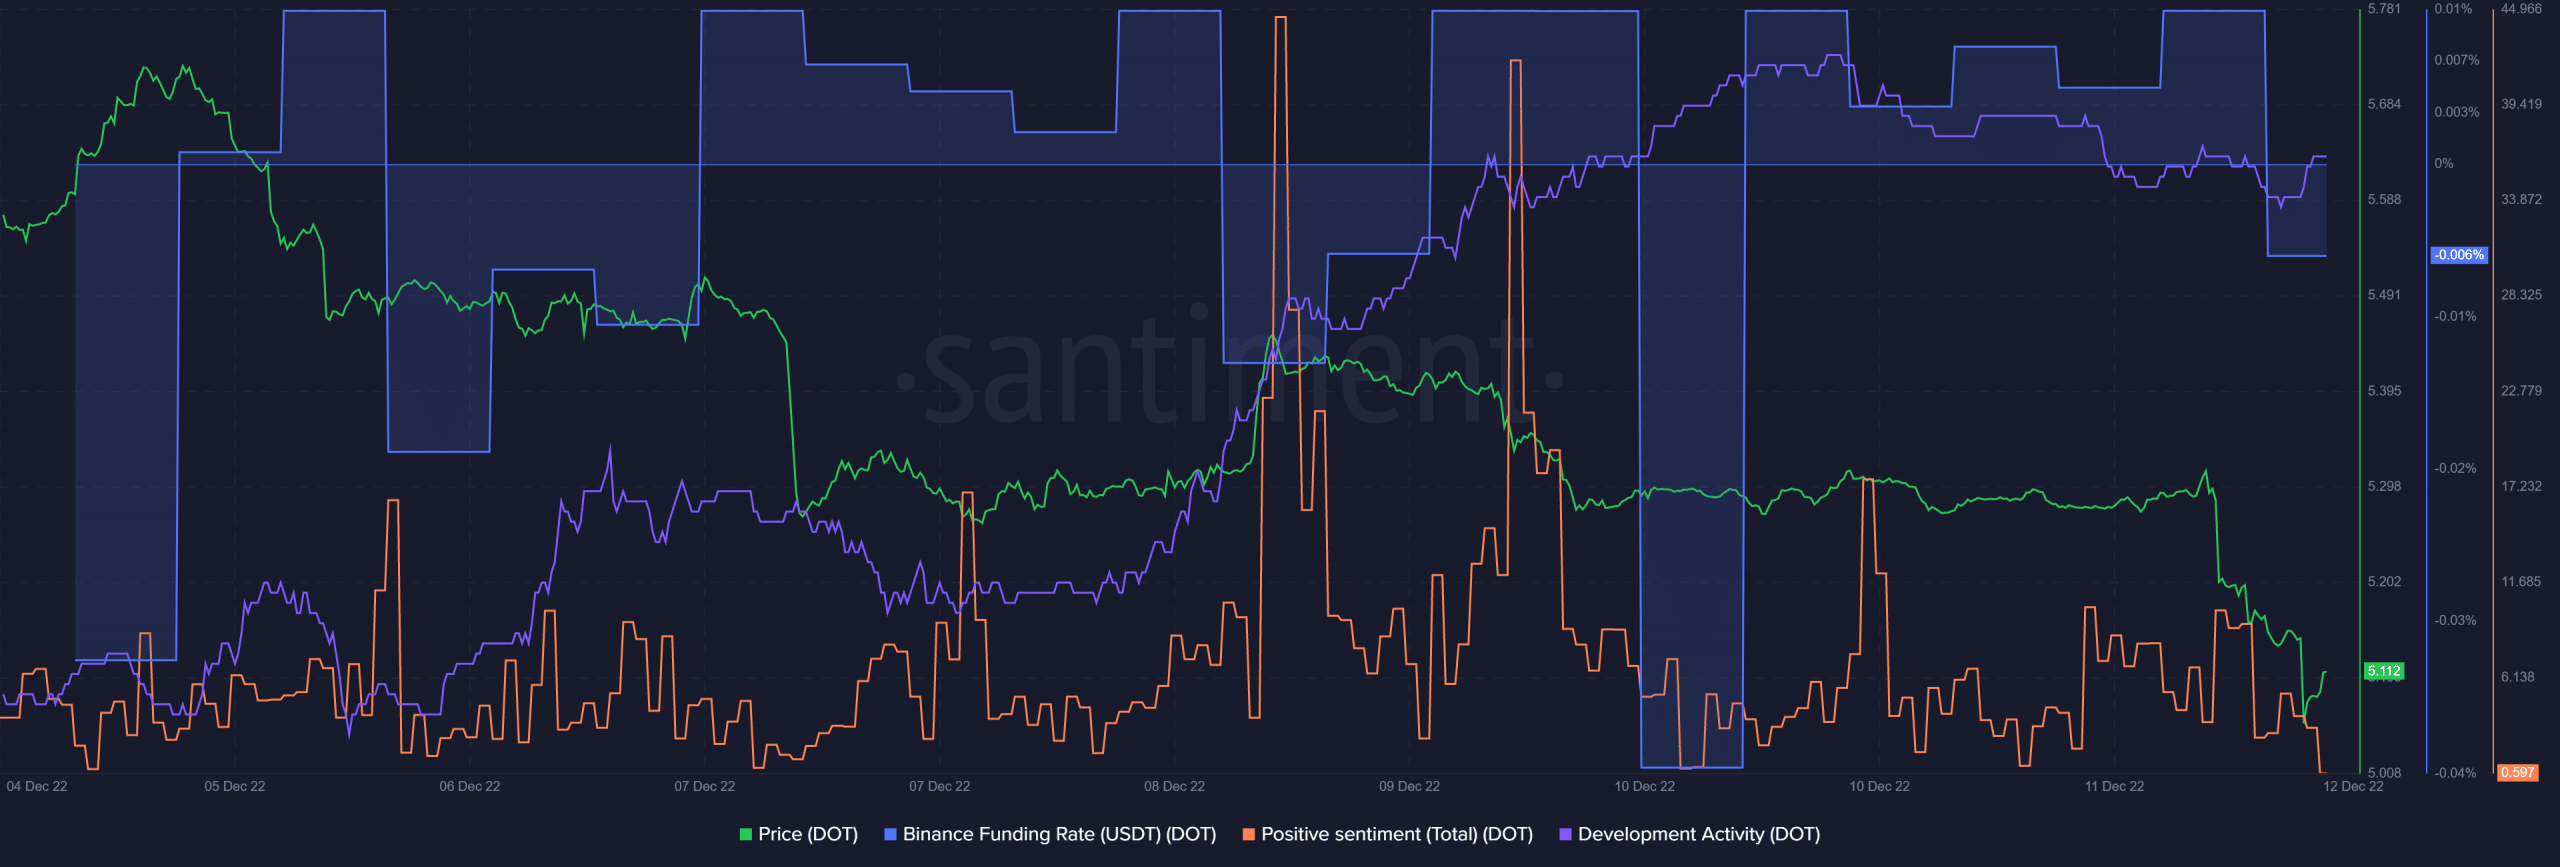
However, the good news was that despite the sharp decline in DOT’s Binance funding rate, the graph registered an uptick. This suggested higher interest from the derivatives market. Last week, DOT’s funding rate took a blow and went down substantially, which indicated the opening of several short positions.
As a result of this development, most short traders were severely liquidated. Apart from the funding rate, another positive update was that DOT’s development activity gained northward momentum and increased over the week.
Can the indicators save Polkadot?
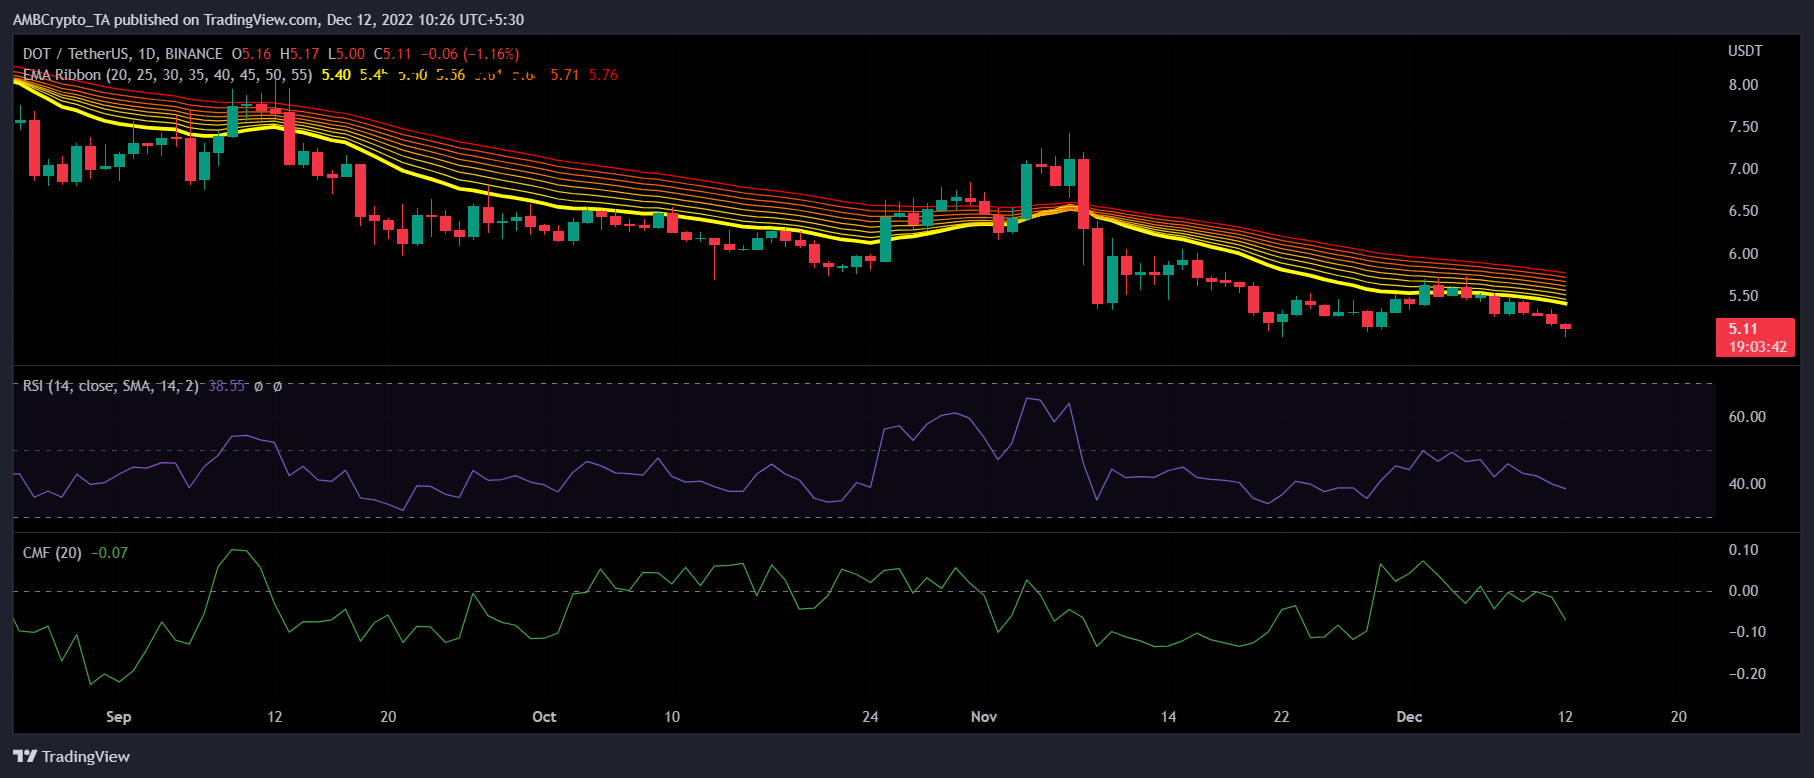
Polkadot’s daily chart yet again favored the sellers, as most market indicators suggested a further price drop. The Exponential Moving Average (EMA) Ribbon revealed that the 20-day EMA was resting below the 55-day EMA, indicating a bearish edge.
Moreover, both the Relative Strength Index (RSI) and Chaikin Money Flow (CMF) registered downticks, further decreasing the chances of a northbound breakout.