As NEAR slips beneath the $5.5 zone once again, where is it headed next

Disclaimer: The findings of the following analysis are the sole opinions of the writer and should not be considered investment advice.
NEAR Protocol has been in a downtrend on the price charts for most of April and all of May, but the past few days appeared to offer some hope for the bulls. NEAR saw a strong rally from the $4.78 support level, as Bitcoin also broke out past the $30.6k mark.
However, Bitcoin slipped back beneath this level, and NEAR retraced a good chunk of its recent gains as well.
NEAR- 1 Hour Chart
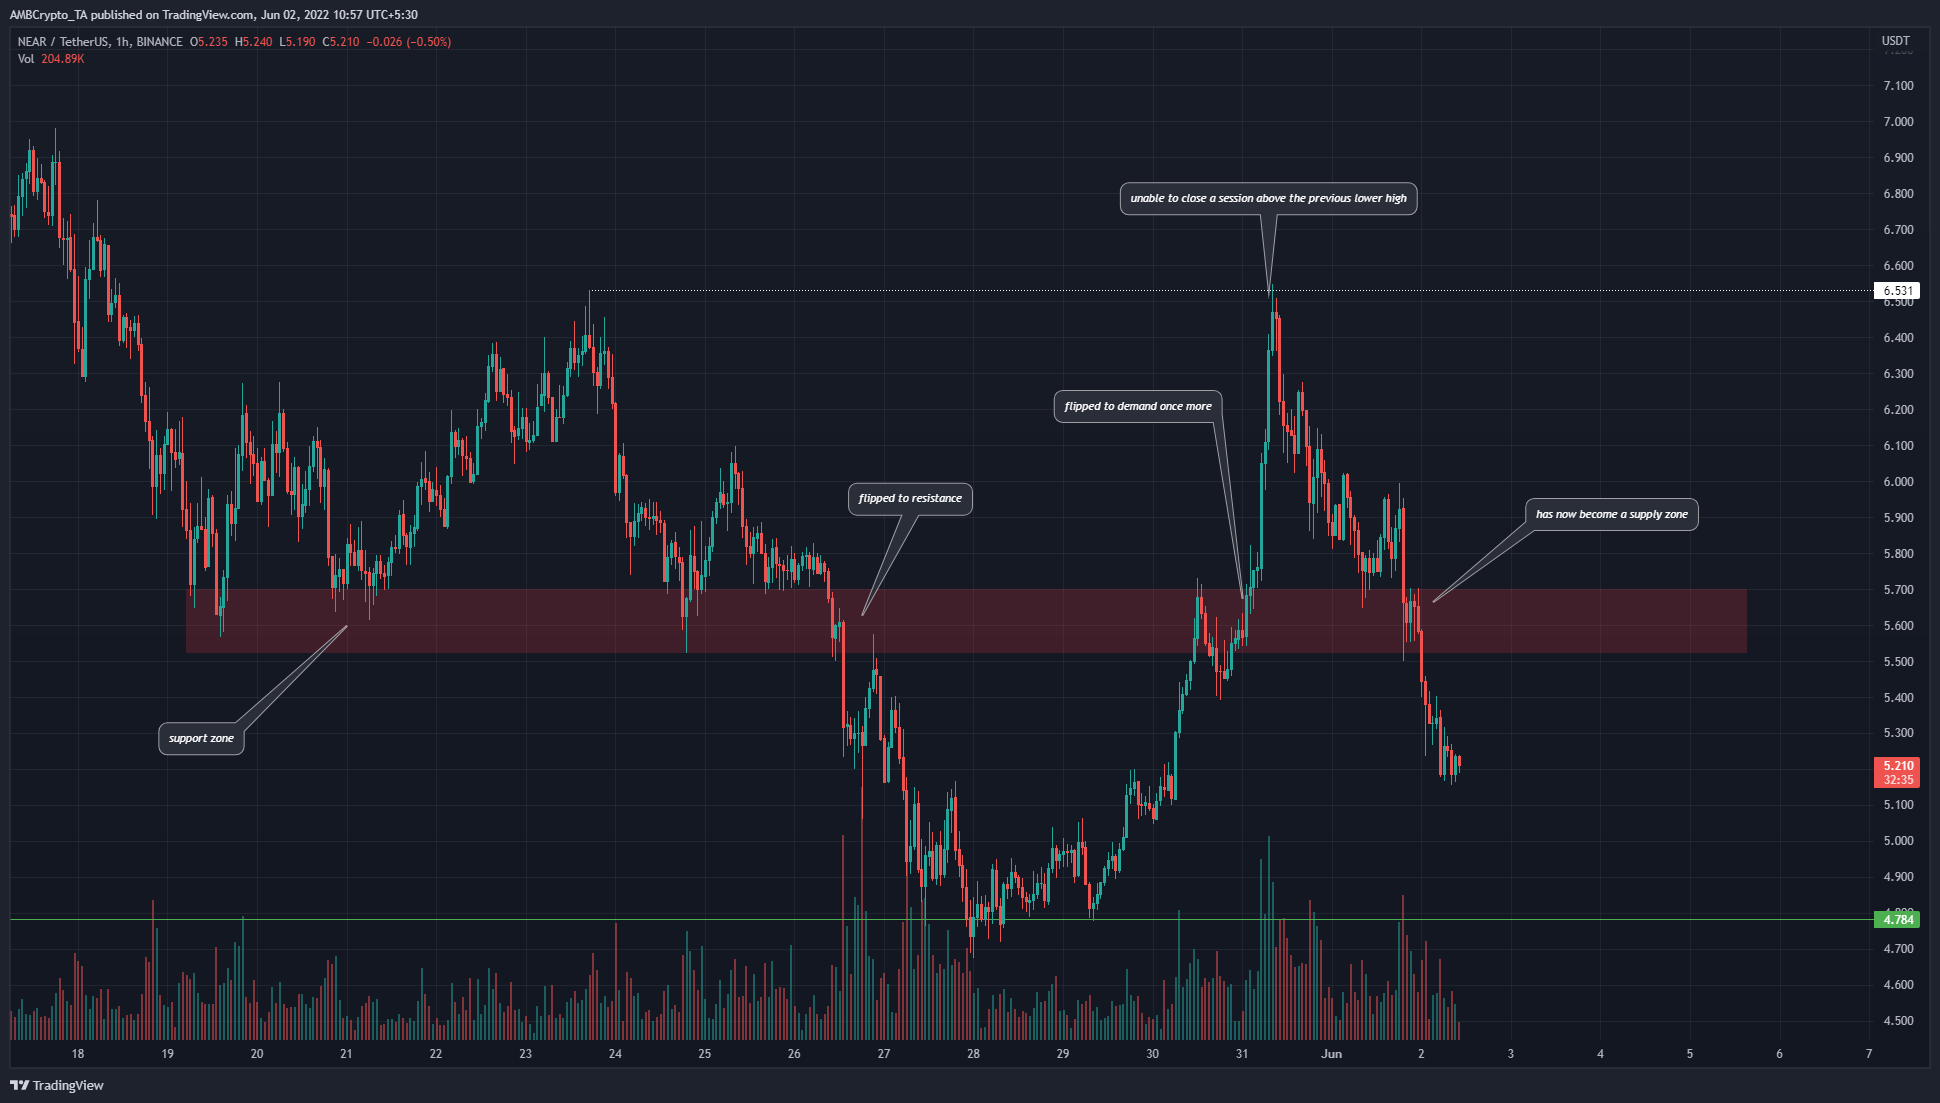
The $6.53 level (dotted white) and the $5.5-$5.7 area (red box) have been important sections on the price chart over the past two weeks, alongside the $4.78 support level. We can see that the $5.5 zone has acted as support, then resistance, and flipped over yet again as bulls and bears contested this level.
At the time of writing, it has been broken and could serve as a zone of supply on a retest. This break to the downside came after a wild surge to $6.5 from the $4.78 lows a couple of days ago, a nearly 36% move upward.
The rejection at $6.5 suggested that the price has retested the former highs, and sellers were strong enough to force a move straight downward, and beneath the $5.6 support zone. Therefore, it would not be surprising if NEAR slipped beneath the $4.78 level as well in the next week or two. Alternatively, NEAR could establish a range from $4.78 to $6.5.
Rationale
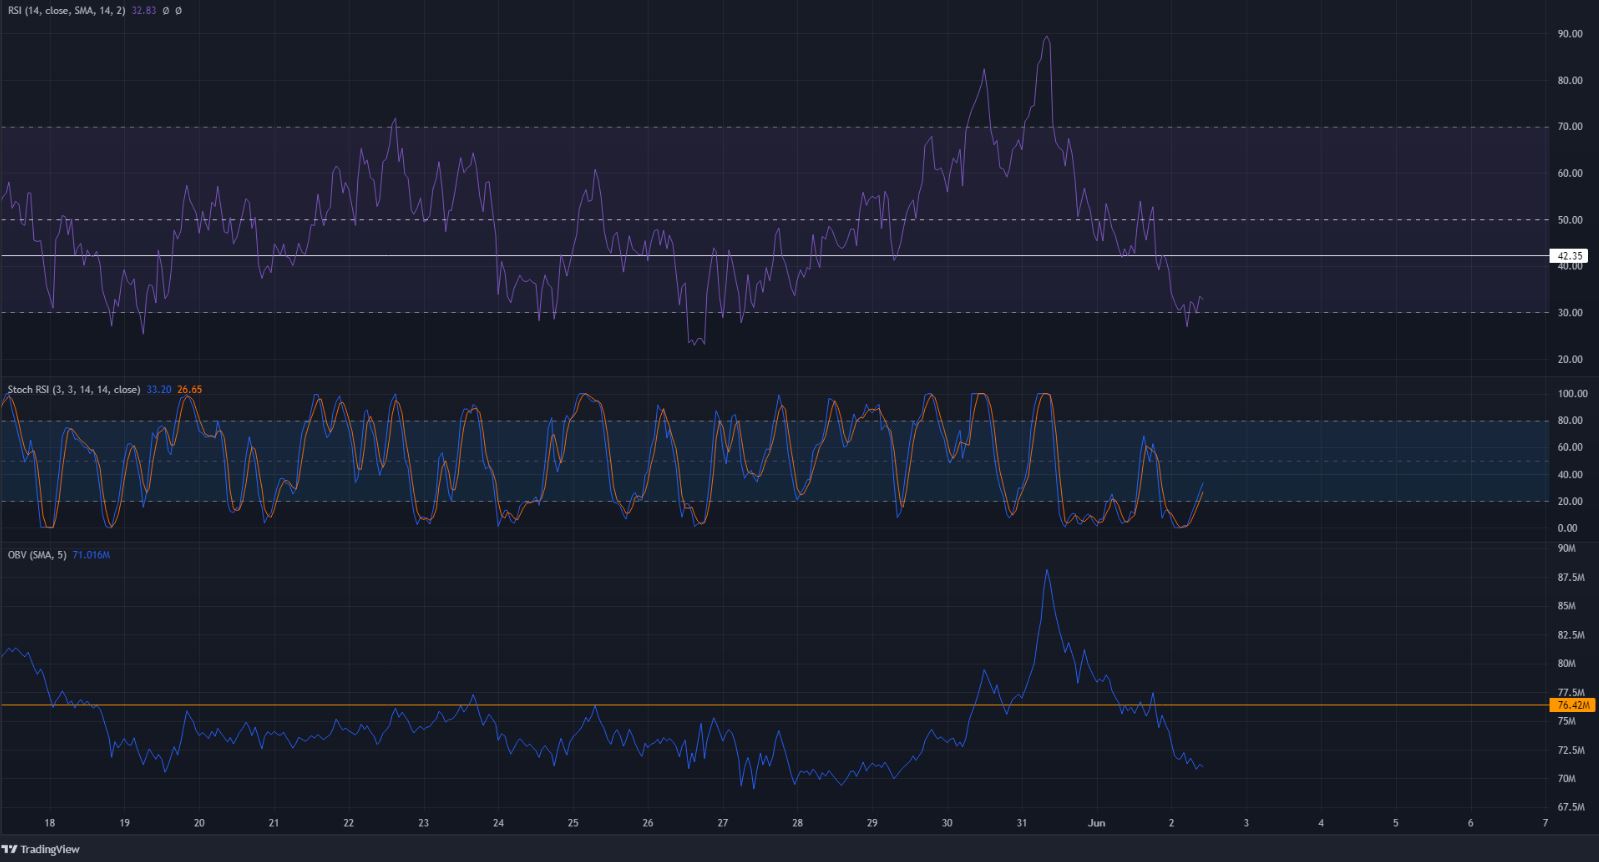
The RSI sank below neutral 50 on the hourly chart. At press time it stood at 32.8 to show strong bearish momentum. The 42 mark has been important in the past on the RSI, and bulls would want to see the RSI climb past this level. The Stochastic RSI formed a bullish crossover and was climbing, to show that a slight pullback upward could occur before another leg downward.
The OBV soared higher on Monday but subsequently came crashing down as selling volume began to dominate and undo the bulls’ gains. In doing so, the OBV slipped back beneath a two-week resistance.
Conclusion
The $4.78 and the $5.5 levels are likely to act as support and resistance over the next few days, and it was possible that NEAR would establish a range from the $4.78 lows to the $6.5 highs. However, a drop beneath $28.5k for Bitcoin could see NEAR lose the $4.78 support level.


