As Polkadot [DOT] wraps up a promising Q1, will Q2 follow suit
Polkadot in Q1 2023 witnessed multiple new integrations and launches. The token’s market cap also registered 51% QoQ growth.
![Polkadot’s [DOT] developer contribution sat on top in Q1, but Q2 metrics seem concerning](https://ambcrypto.com/wp-content/uploads/2023/04/DOT-4.png)
- Polkadot’s developer contribution soared in Q1 2023.
- DOT started Q2 on a concerning note as its price plummeted.
Polkadot [DOT] published its first quarter report for 2023, highlighting the ecosystem’s major developments. A key highlight of Polkadot in Q1 was its development activity. In March 2023, 19,090 developer contributions were tracked on GitHub repositories, a record for a single month for any network.
1/💥The Polkadot Q1 report is up, and the headline news is some turbo-charged dev stats!
Per @santimentfeed data, Polkadot was top among all Web3 networks for all 3 months, peaking with a record 19,090 developer contributions in March.
Full detail here➡️https://t.co/brv2inAtdg pic.twitter.com/NX7mG422if
— Polkadot (@Polkadot) April 24, 2023
Read Polkadot’s [DOT] Price Prediction 2023-24
Multiple new integrations and launches
The year began with the launch of a digital collectible marketplace on Polkadot’s parachain, Aventus. Beatport will work with Polkadot on 10 significant events over the course of the following 18 months, besides launching the new marketplace.
Additionally, KILT revealed a partnership with Public Pressure to create the identification of the assets by issuing identity credentials on NFT collections. This will help artists add certificates of authenticity.
Apart from this, another major development was the rollout of XCM v3, which is Polkadot’s standard for cross-chain and cross-consensus communication. 59,004 XCM messages in total were sent throughout the previous quarter.
Price went on a rollercoaster ride
Q1 2023 began on a good note as DOT’s price increased substantially, thanks to the bull market. DOT registered a 51% quarter-on-quarter (QoQ) increase in market cap and a 28% QoQ revenue growth.
However, the hike was short-lived, as DOT’s price plummeted in February. DOT’s Relative Strength Index (RSI) was high during the initial week of Q1, but it then remained near the neutral mark since the price plummeted.
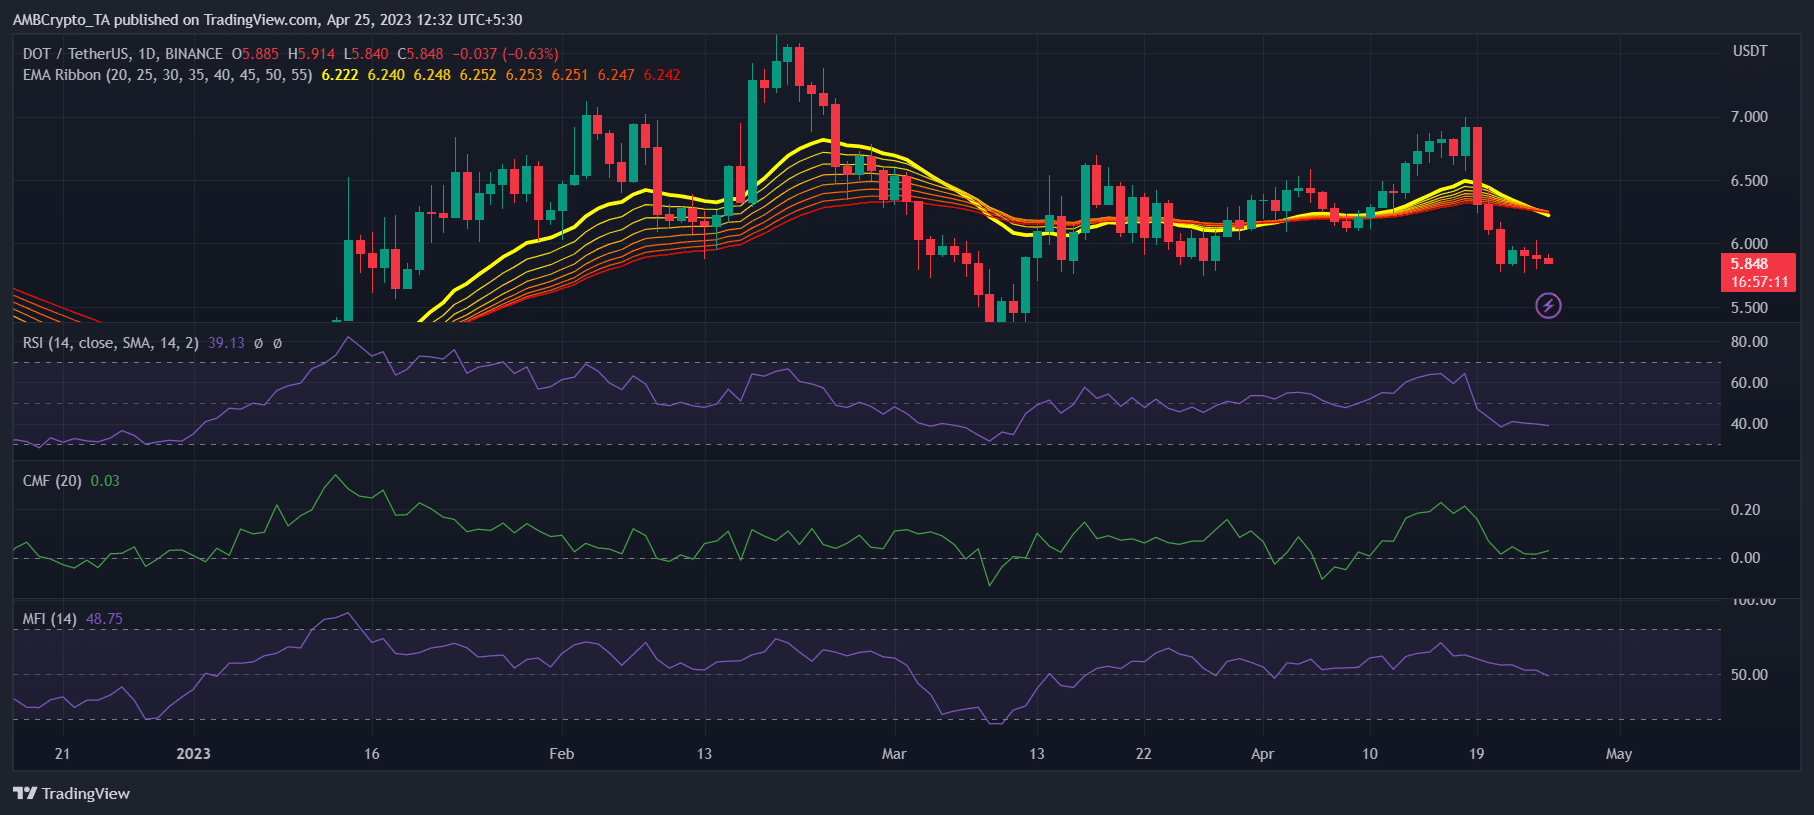
A similar trend was also seen with Polkadot’s Chaikin Money Flow (CMF) and the Money Flow Index (MFI). The Exponential Moving Average (EMA) Ribbon revealed that the bulls led the market during the majority of the days in Q1.
However, the bulls lost their grip during the concluding weeks as the 20-day EMA and the 55-day EMA were closely knit.
Is your portfolio green? Check the Polkadot Profit Calculator
DOT in Q2 2023
The second quarter did not begin on the same note as Q1, as DOT’s price declined sharply. As per CoinMarketCap, DOT was down by over 13% in the last seven days. At press time, it was trading at $5.86 with a market cap of over $6.8 billion.
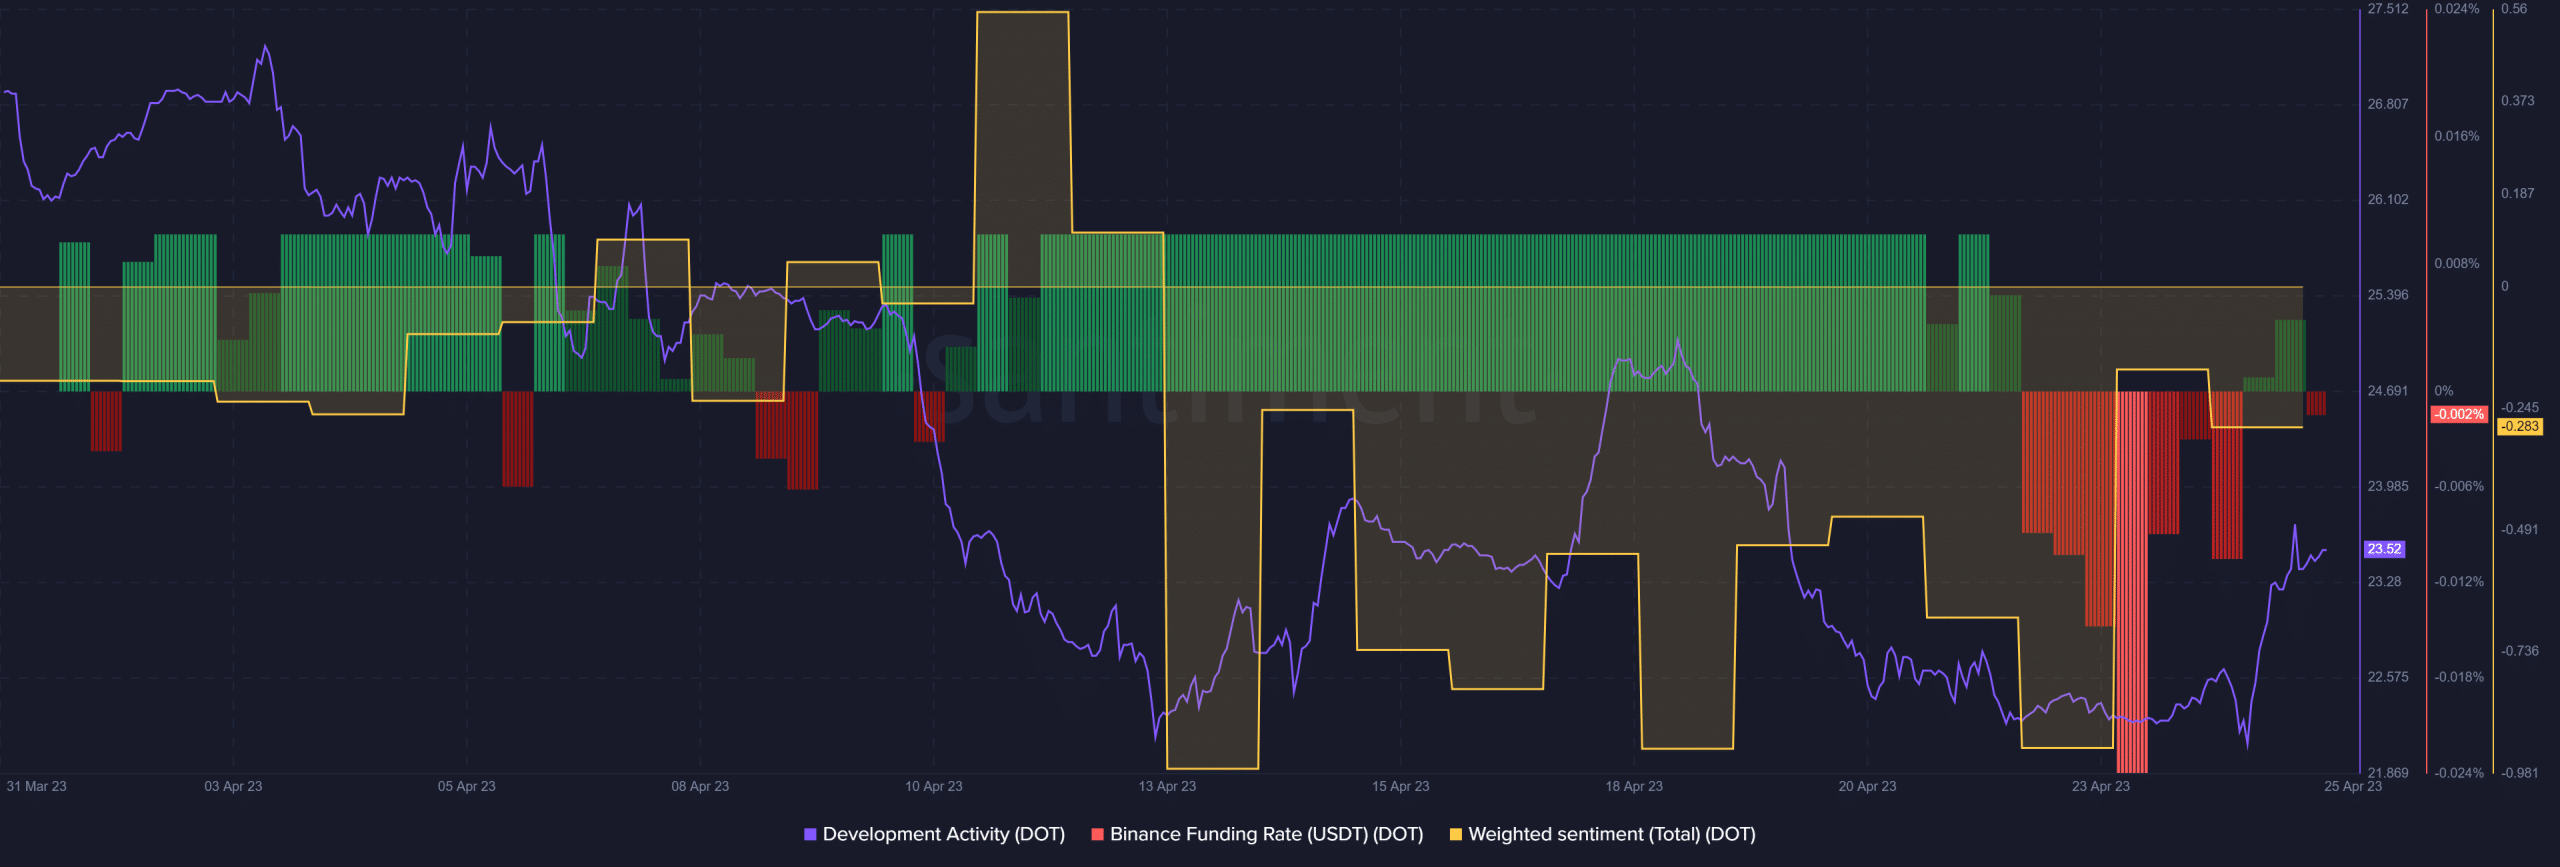
Unlike its history, DOT’s development activity declined considerably during Q2. Weighted sentiment also drifted on the negative side, which did not look good for DOT. Though DOT’s demand in the derivatives market was high in the beginning, its Binance funding rate plummeted over the last few days.