As XLM breaks out of a compression phase, here’s where its headed next

Disclaimer: The findings of the following analysis are the sole opinions of the writer and should not be considered investment advice
Stellar Lumens has seen steady demand in recent days. Interestingly, despite the bullish advance, trading volume and transactions count (daily basis) has remained pretty much unchanged in the past month, according to data from Messari. What, then, explains the recent gains? Price action tells a story of its own, and at press time, Stellar Lumens could be attracted toward a zone of liquidity in the days/weeks to come.
XLM- 1D
The market structure for XLM on a long-term outlook had been bearish since May 2021. It did have impressive rallies in the same time period, but the prevailing trend had still pointed to the downside.
In the time period from July to November, XLM appeared to have flipped its market structure to bullish and looked ready to rise toward its highs at $0.65 and $0.7, but the sell-off behind Bitcoin saw XLM plummet as well.
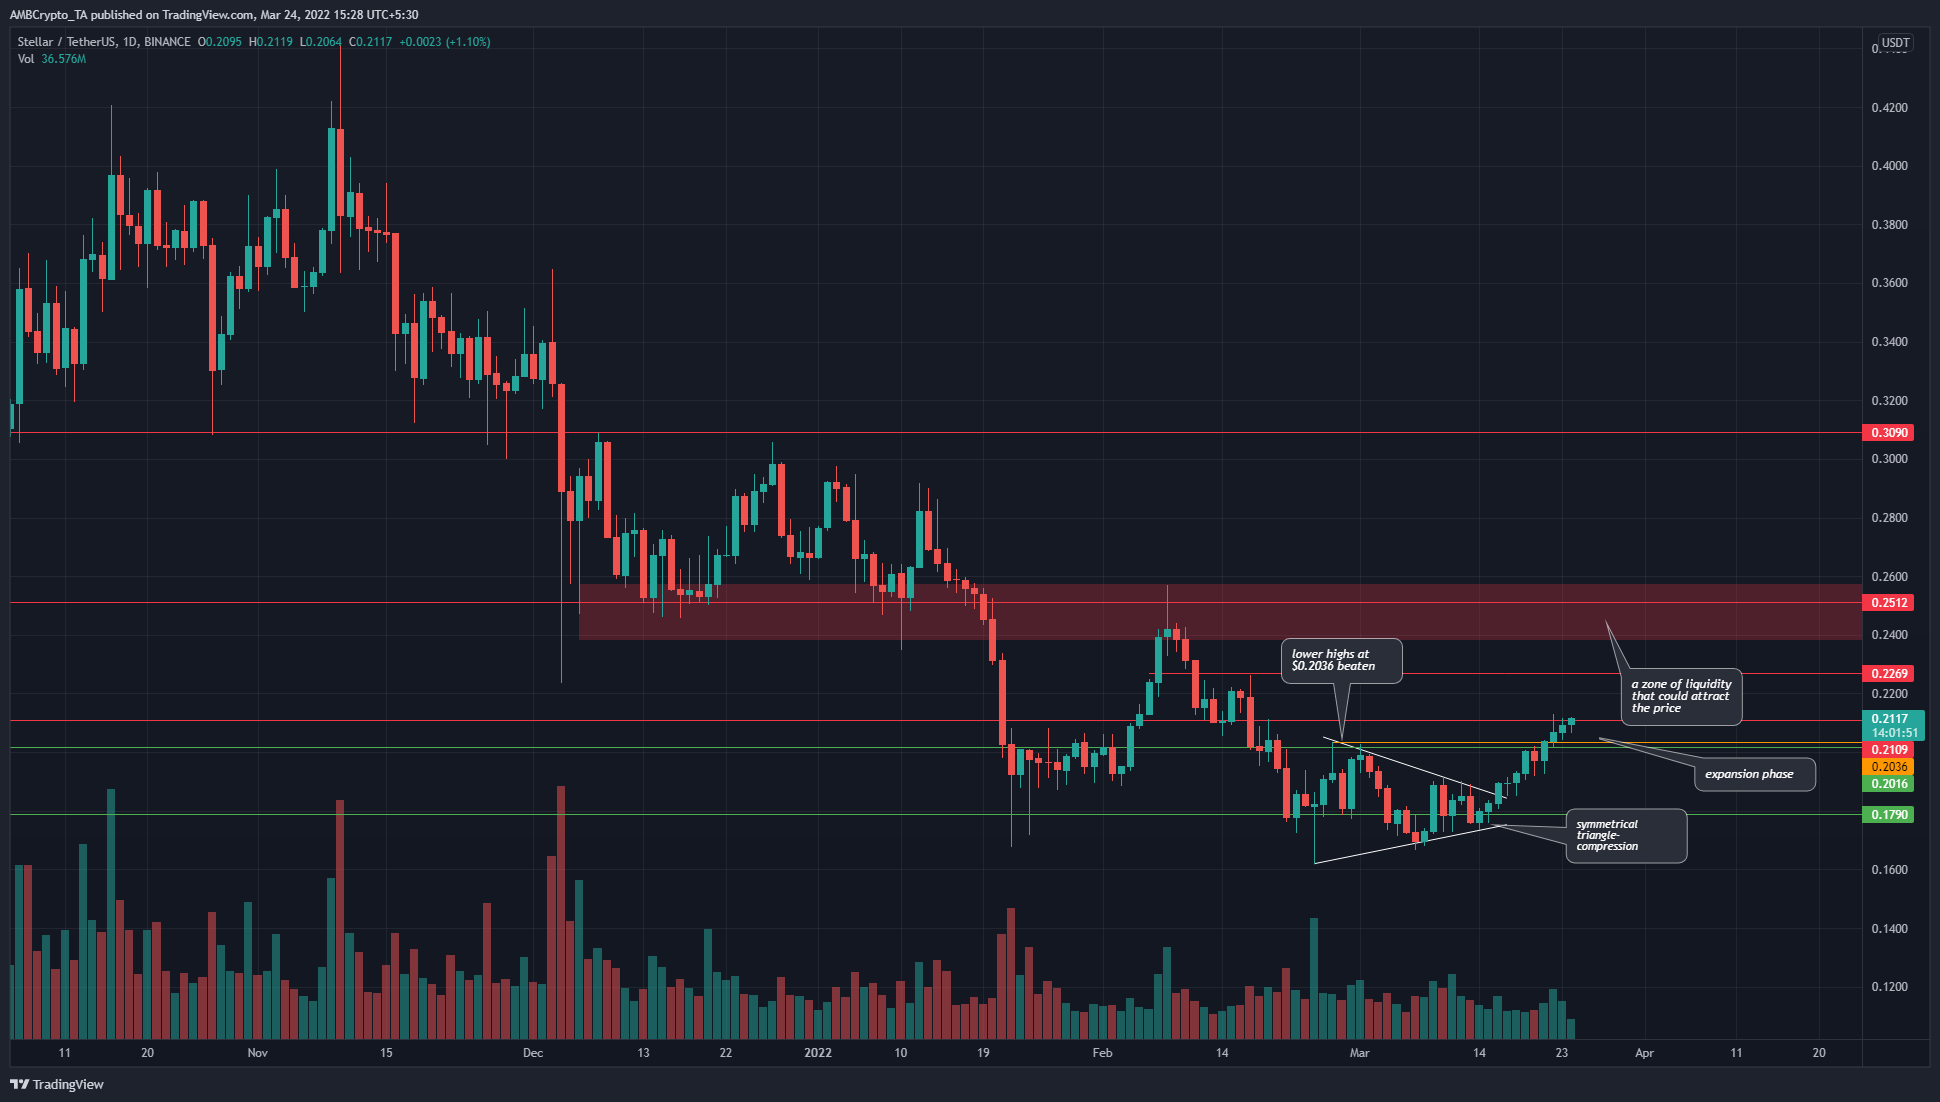
At the time of writing, XLM once more appeared ready to have a strong run upwards. There is a significant zone at $0.25 where sellers are likely to be strong. However, as things stood, the move above $0.2036 in recent days was encouraging. Particularly so because this move had followed nearly a month of compression within a symmetrical triangle (white)- a phase of compression for the price.
Rationale
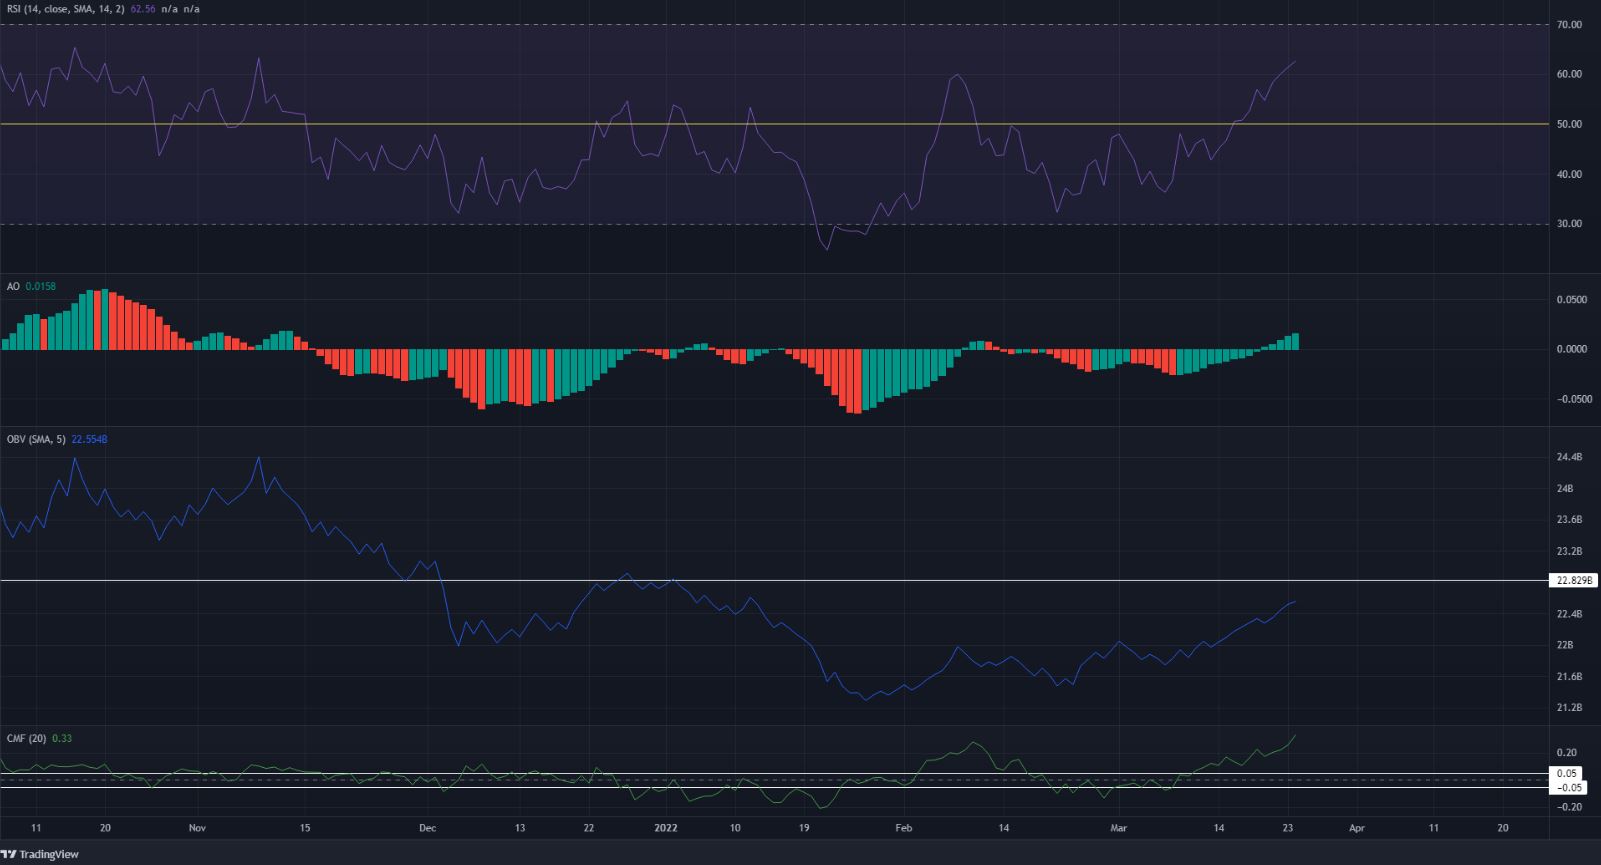
The RSI soared past neutral 50 to stand at 62.5 at press time, while the Awesome Oscillator also rose above the zero line on the daily chart. This was evidence that momentum was indeed bullish, and a bearish divergence of any sort was not yet seen on this timeframe, which indicated further upside remained possible.
The OBV has also been trending upward in the past month, and the buying volume looks strong enough to propel prices higher.
Conclusion
How much higher, though, for XLM? The $0.23, $0.25, and $0.3 are places where long positions can look to sell with the $0.238-$0.257 (red box) being an area of extra significance. At press time, a bullish bias for Stellar Lumens was warranted.