
Cardano’s rally intact! – But THIS could stall ADA’s $1.15 hopes

- A significant increase in the number of new wallets fuelled AAVE’s recent price surge.
- Despite the rally facing rejection at $180, more bullish signs are still in play.
AAVE [AAVE] has been among the top performers in the cryptocurrency market, with its 7-day gains standing at 20% at press time.
As a result of this rally, AAVE’s market capitalization has increased nearly two-fold within three months to more than $2.5 billion.
AAVE’s gains in Q3 2024 happened when the broader market saw choppy price movements. As a result of this, a significant number of new AAVE wallets sprouted up as traders sought to book profits.
Per Santiment, the wallets holding at least 100 AAVE tokens have increased by more than 7% since mid-June to around 3,229 wallets. This increase is behind the buying momentum that has pushed AAVE higher.
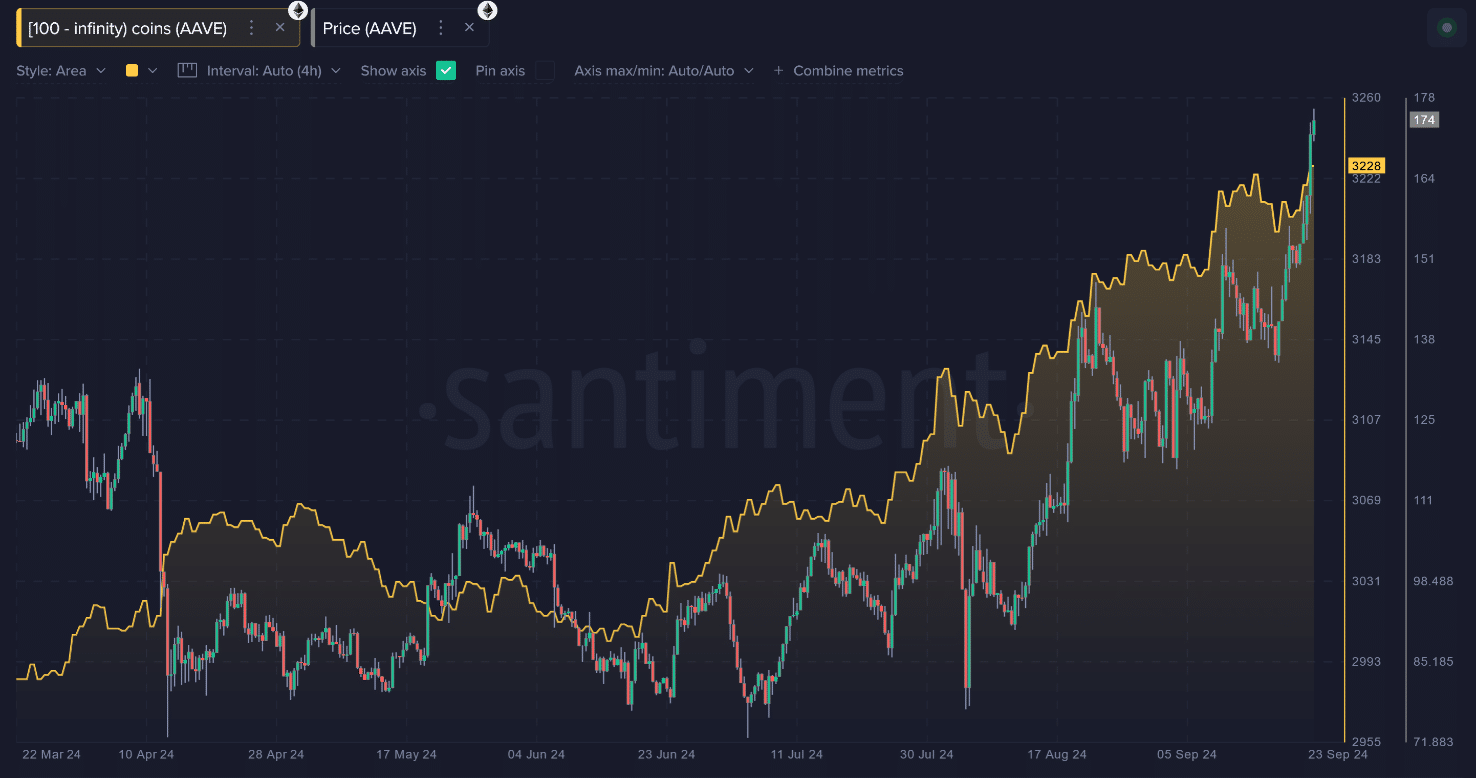
Source: Santiment
Buyers remain in control of AAVE’s price action, as seen in the Chaikin Money Flow (CMF). This indicator has maintained a positive value since August.
Furthermore, the Relative Strength Index (RSI) at 69 showed that bullish momentum was still in play.
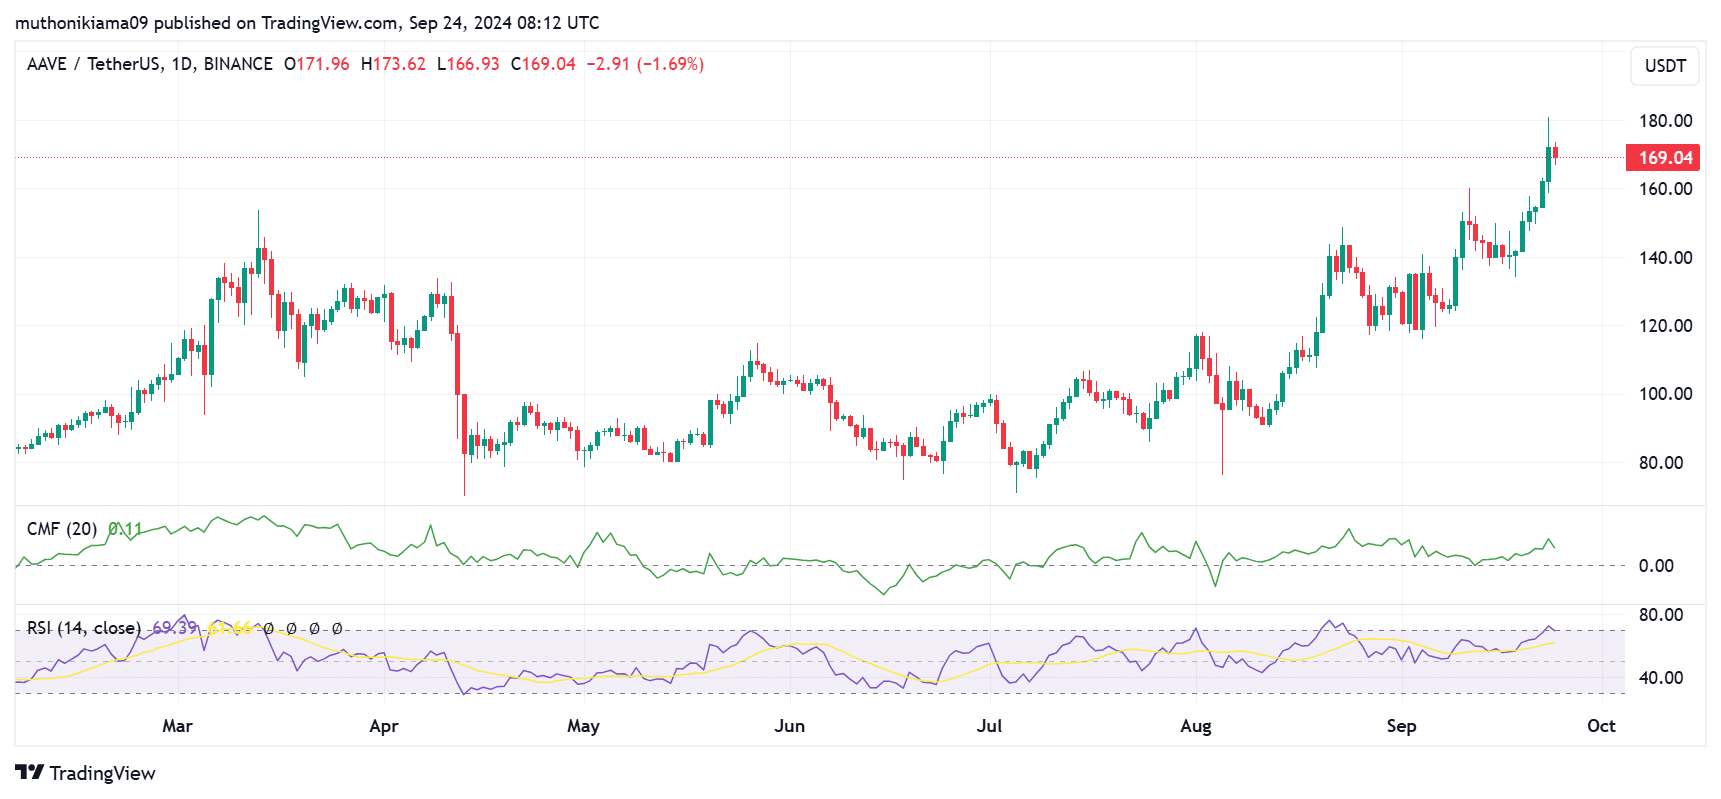
Source: TradingView
However, given that AAVE has more than doubled in price since August, are there telltale signs that the token may be getting overheated?
AAVE price prediction
AAVE traded at $168 at press time and continued to trend within an ascending channel on the one-day chart.
A breakout from this channel failed after the altcoin encountered resistance at $180, causing a swift correction.
AAVE’s uptrend was rejected at this price after it hit overbought conditions as seen in the Williams %R indicator. This metric has since dropped to -24 suggesting that the rally has cooled.
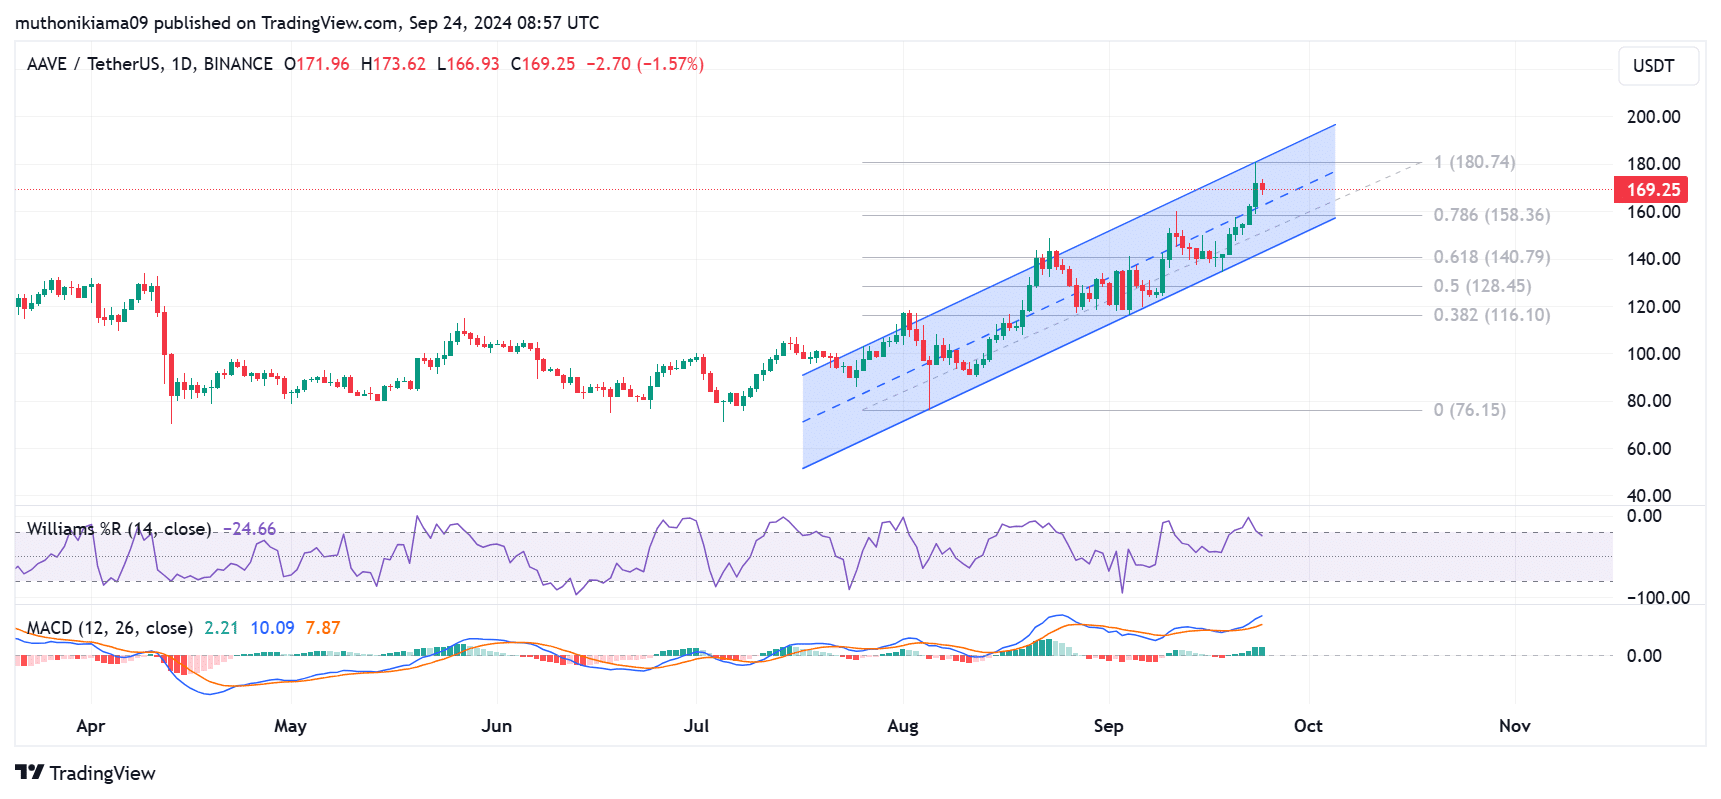
Source: TradingView
Despite the drop, AAVE was still trading above the midline of this channel, with support lying at the 0.786 Fibonacci level ($158).
A continuing trend in this zone could see AAVE attempt another breakout if buying momentum remains strong.
Conversely, if AAVE fails to sustain levels above another crucial support at $148, the price could drop below the lower trendline of this channel, igniting a bearish reversal.
Traders who bought into the rally could also start selling if this support fails, to minimize their losses.
Read Aave’s [AAVE] Price Prediction 2024–2025
At the same time, more than 456,000 AAVE tokens were bought at the $161-$182 price levels.
Therefore, AAVE might experience some volatility within these price levels as these traders seek to mitigate their losses or maximize profits.
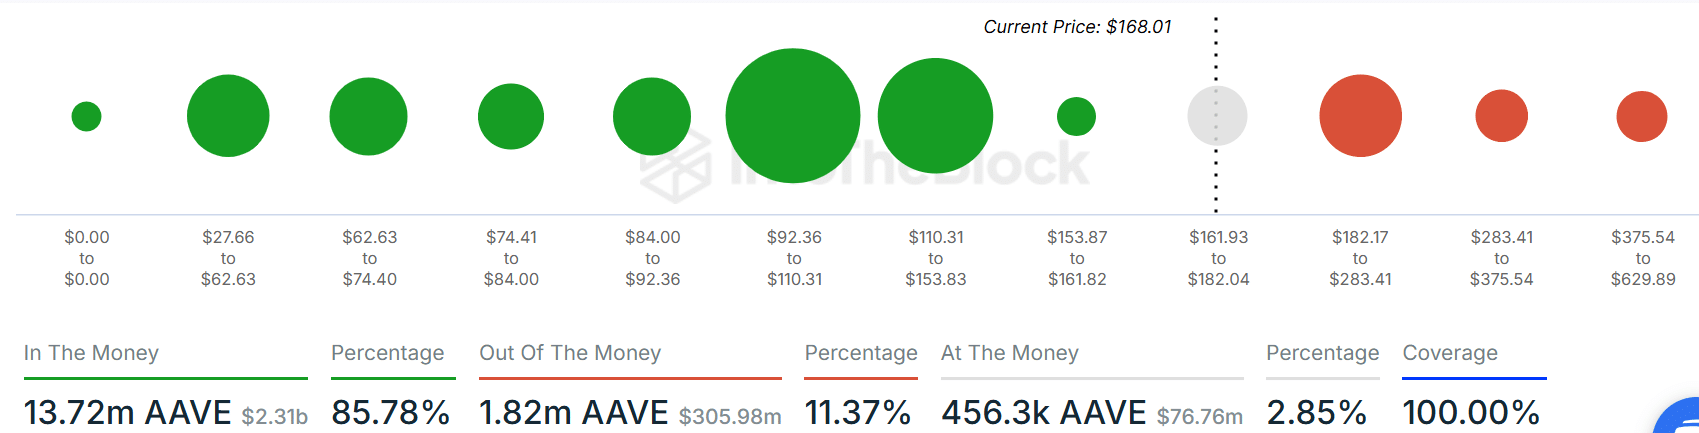
Source: IntoTheBlock


