Assessing Bitcoin’s October fortunes after a bearish September
Bitcoin faces consecutive declines but hovers near key resistance levels, sparking hope for a potential October rally if bullish momentum builds.

- BTC has managed to stay close to its psychological resistance level.
- Indicators showed the potential for a price breakout.
Historically, September has been a turbulent month for Bitcoin [BTC], often marked by significant negative trends.
Despite this, the king coin has maintained a relatively stable price, staying close to its current psychological resistance level. We may see a more positive movement in October if this trend holds.
Bitcoin faces consecutive declines
Over the past three days, Bitcoin has experienced consecutive declines, trading at around $58,650 at press time.
This downward trend began on the 14th of September, following Bitcoin’s surge above its psychological barrier during the previous trading session. BTC rose over 4% in that session, reaching approximately $60,543.
This uptrend briefly pushed BTC into a bullish phase, with its Relative Strength Index (RSI) climbing to around 50. However, the RSI rested on the neutral line at press time, signaling a weakening in the bull trend.
Bitcoin: October rally ahead?
Moving into October, Bitcoin’s price was hovering near key technical levels. The yellow line represented the 50-day moving average, at $59,495.25, while the blue line marked the 200-day moving average at $63,997.09.
Bitcoin was trading near the 23.6% Fibonacci retracement level, around $58,104.92, indicating potential resistance. On the downside, the $55,000 level emerged as the next significant support, based on Fibonacci extensions.
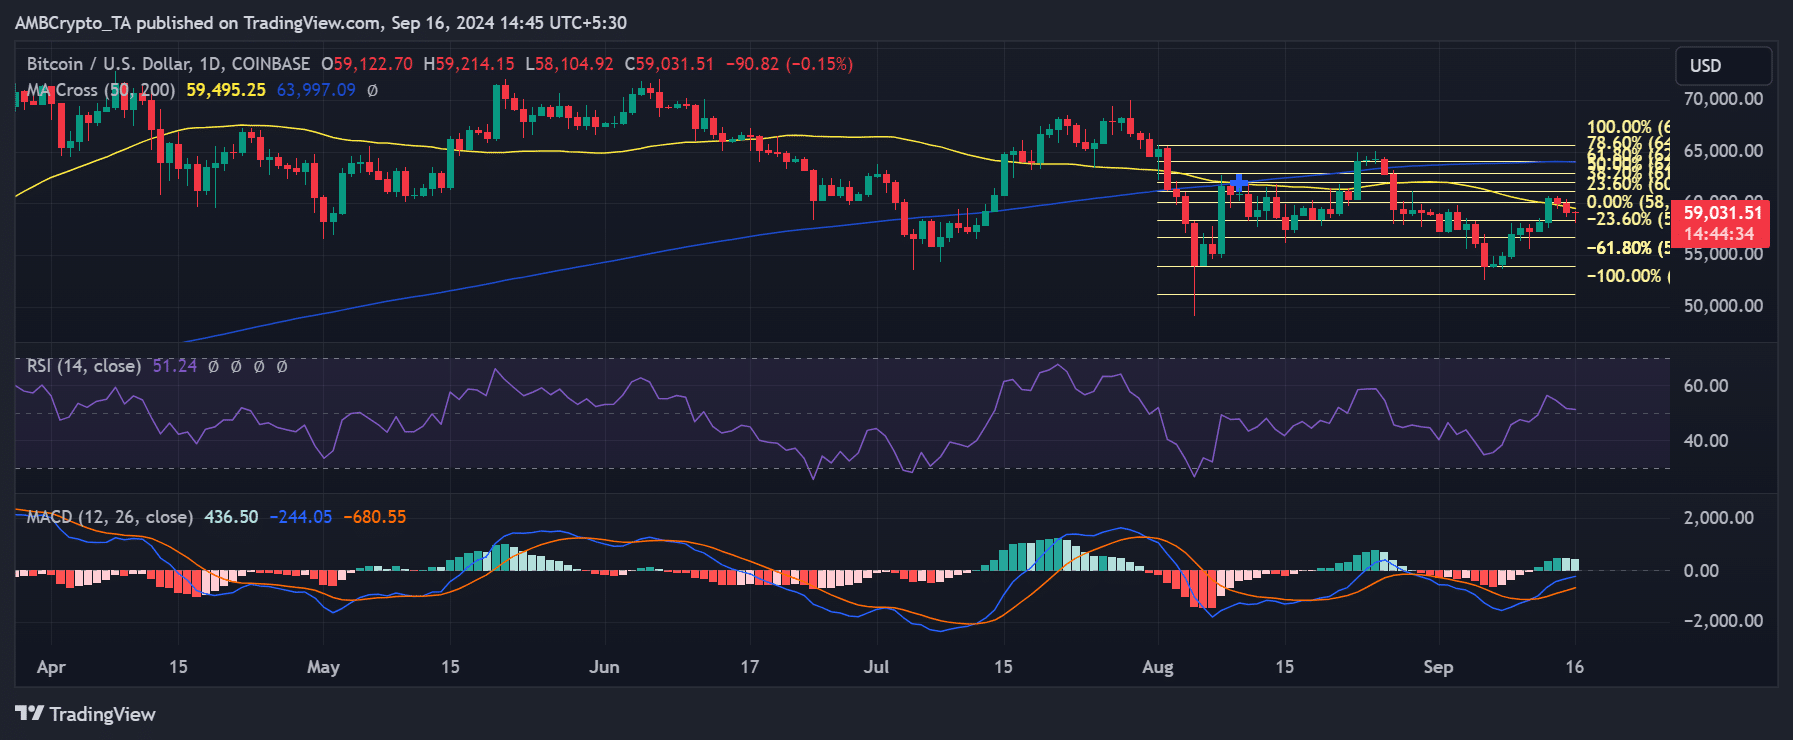
Suppose BTC can break above the 50-day moving average around $59,500 and maintain momentum. In that case, it may reach the 200-day moving average at $63,997, an important resistance level.
Positive indicators from the MACD and a neutral Relative Strength Index (RSI) suggested a possible upward movement in October, especially if bulls regain control.
A surge to the $63,000 range could trigger FOMO (fear of missing out), potentially driving BTC to retest its all-time high.
Supply on exchanges shows a slight uptrend
Recent analysis on Santiment indicated a slight uptrend in the supply of Bitcoin on exchanges. Despite this increase, trading volume has remained relatively stable, staying within the same threshold.
Read Bitcoin’s [BTC] Price Prediction 2024-25
At the time of writing, the total BTC supply on exchanges was approximately 1.8 million.
Given the recent market declines, this uptrend in supply could signal a higher probability of significant upward movement in October, as Bitcoin may be poised for a potential rally.