
Powell, tariffs, and BTC: The perfect storm for Bitcoin’s next big move?

After registering a couple of long green candles on the 30-minute chart, Ethereum’s price momentarily breached $4k on Friday. In fact, the market’s largest alt evidently fared better when compared to Bitcoin, over the past week. The former managed to appreciate by over 21% while the latter’s value witnessed a mere 2% uptick in the aforementioned time window.
Interestingly, at the time of writing, ETH was seen hovering slightly below the $4k juncture – $3,912, to be precise. Ergo, everything at this stage boils down to whether or not Ethereum’s price has room to inch higher? Well, looking at the state of a few key metrics would help in decoding the answer to the aforementioned question.
Cracking the code
For any rally to sustain, the presence of buying momentum becomes quite critical. Interestingly, Ethereum’s Taker Buy-Sell volume just recorded a massive spike at the time of writing. This indicator depicts the ratio between the buy volume and the sell volume.
Whenever takers sell at the ask price, the amount of assets traded contribute to the taker buy volume, thereby making the environment favorable for a price hike.
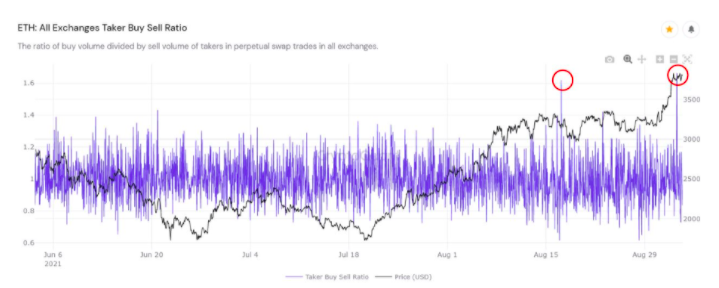
Source: CryptoQuant
Now, as seen from the chart attached, the current market has more Taker buy-volume than the Taker sell-volume, which essentially is an optimistic sign. Further, the reading of this indicator was typically oscillating below 1.2 until quite recently.
However, the current hike in buy-volume has pushed this ratio to a new local high. The same stood beyond 1.6 at press time.
Further, the intensity of bearishness on Ethereum’s price DAA divergence chart has also fairly reduced and is back to its May levels. This indicator tracks the relationship between the alt’s price and the number of daily addresses interacting with it.
Curiously, when the alt’s price rallied from $2800 to $4300 in the April-May period, the intensity of bearishness had similarly reduced. If the same trend continues now, a price movement in the same direction can be expected.
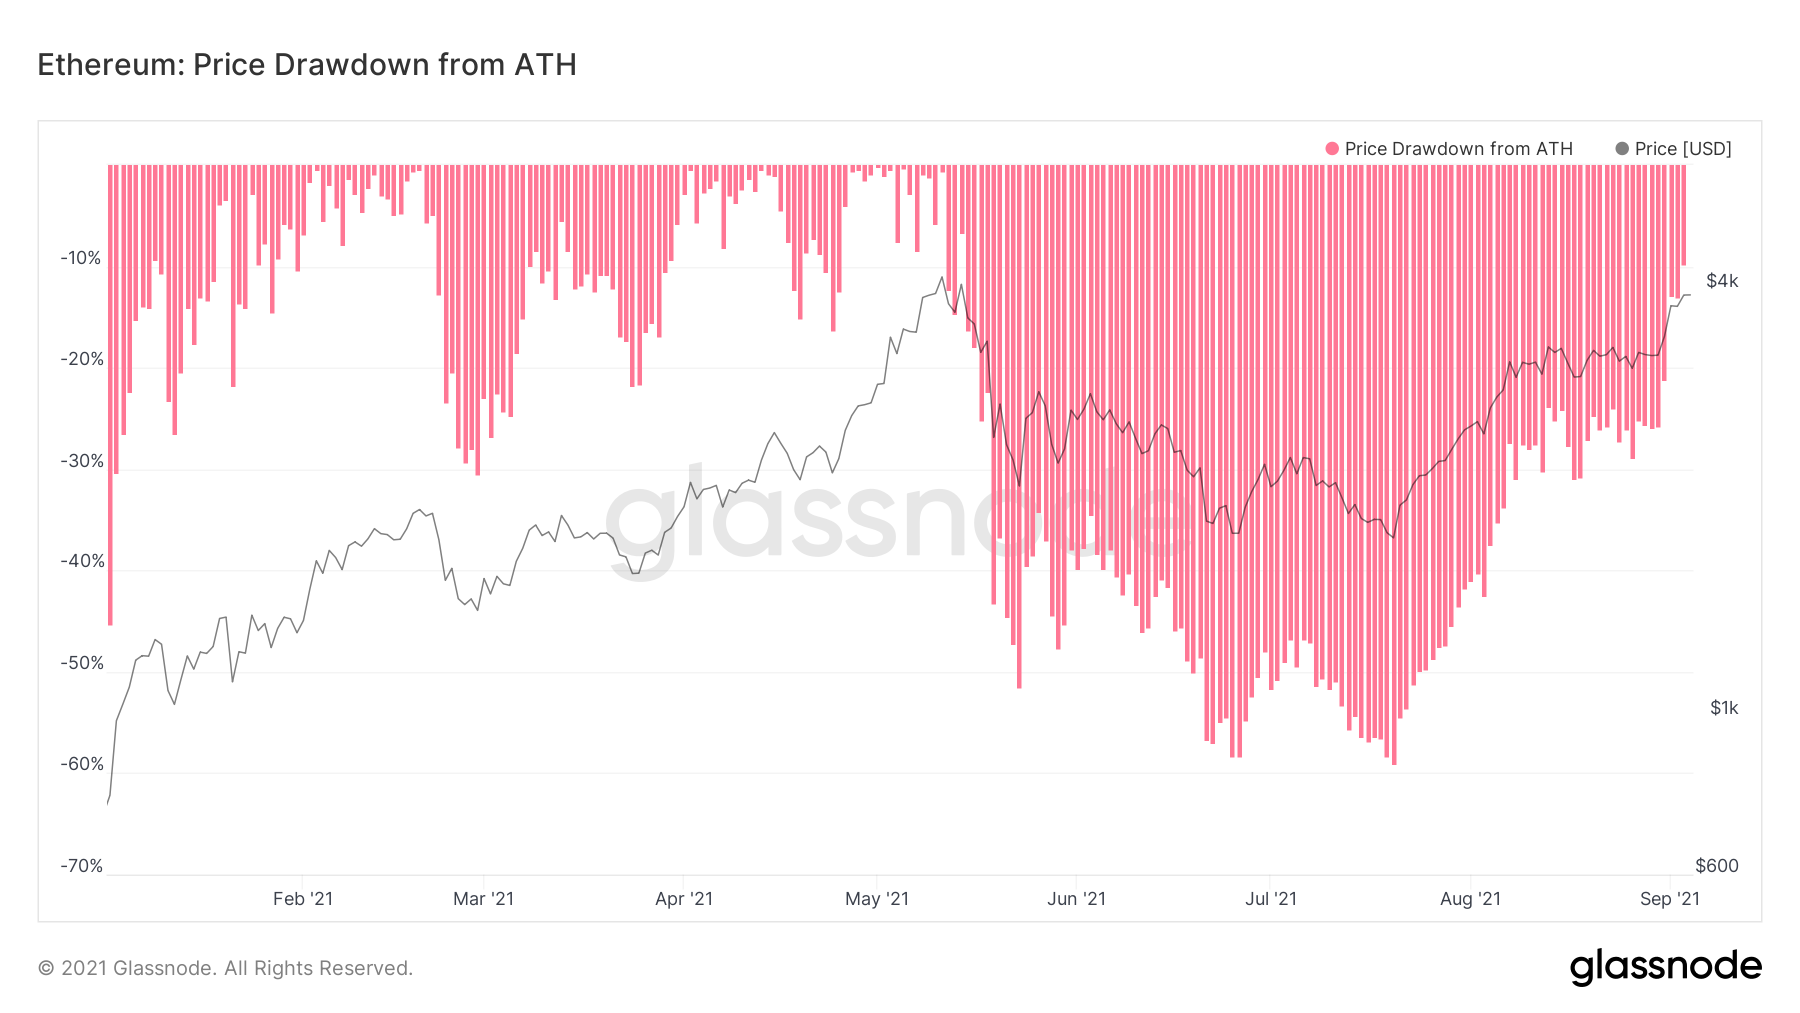
Source: Glassnode
Additionally, the Price Drawdown indicator also highlighted that Ethereum’s downside volatility was dropping. A drawdown is essentially the percentage between the peak and the subsequent trough. It is quite critical in measuring the downside risk involved.
In fact, this indicator flashed a reading of -0.09 [almost 10% less] at the time of writing. Notably, the current level is, again, pretty much at par with that in May.

Source: IntoTheBlock
“Into the Block’s” forward curve too painted a bullish picture at the time of writing. As seen from the chart attached, the curves of all major exchanges – OKEx, Huobi and Deribit have been drifting away from the Backwardation territory and making strides in Contango.
Contango is a situation where the futures price of an asset is higher than its spot price. Going forward, if these curves head in the same direction, the bearish narrative would likely become redundant.
Well, after weighing the indications of the aforementioned metrics, it can be concluded that Ethereum’s price does have room for going higher. Market participants can expect the alt to break above its previous ATHs and surge towards other psychological benchmarks, including $4500, in the coming days.


