Assessing if TRUMP bulls should expect a 10% price bounce soon
Liquidity heatmap showed that $11 could be visited before TRUMP reverses its short-term bounce.

- TRUMP has a bearish structure, but the bullish divergence could lead to a price bounce
- Consistent selling pressure recently meant recovery would be difficult and traders must be wary of going long
Official Trump [TRUMP] has reversed from the $13.84 resistance level. In an analysis piece last week, AMBCrypto pointed out that the $14-level would likely rebuff the bulls and send the memecoin’s price further south.
This has come to pass though, and the 23.6% extension level at $11.59 has recently been flipped to resistance. What’s next for TRUMP?
TRUMP’s bullish divergence could see short-term gains
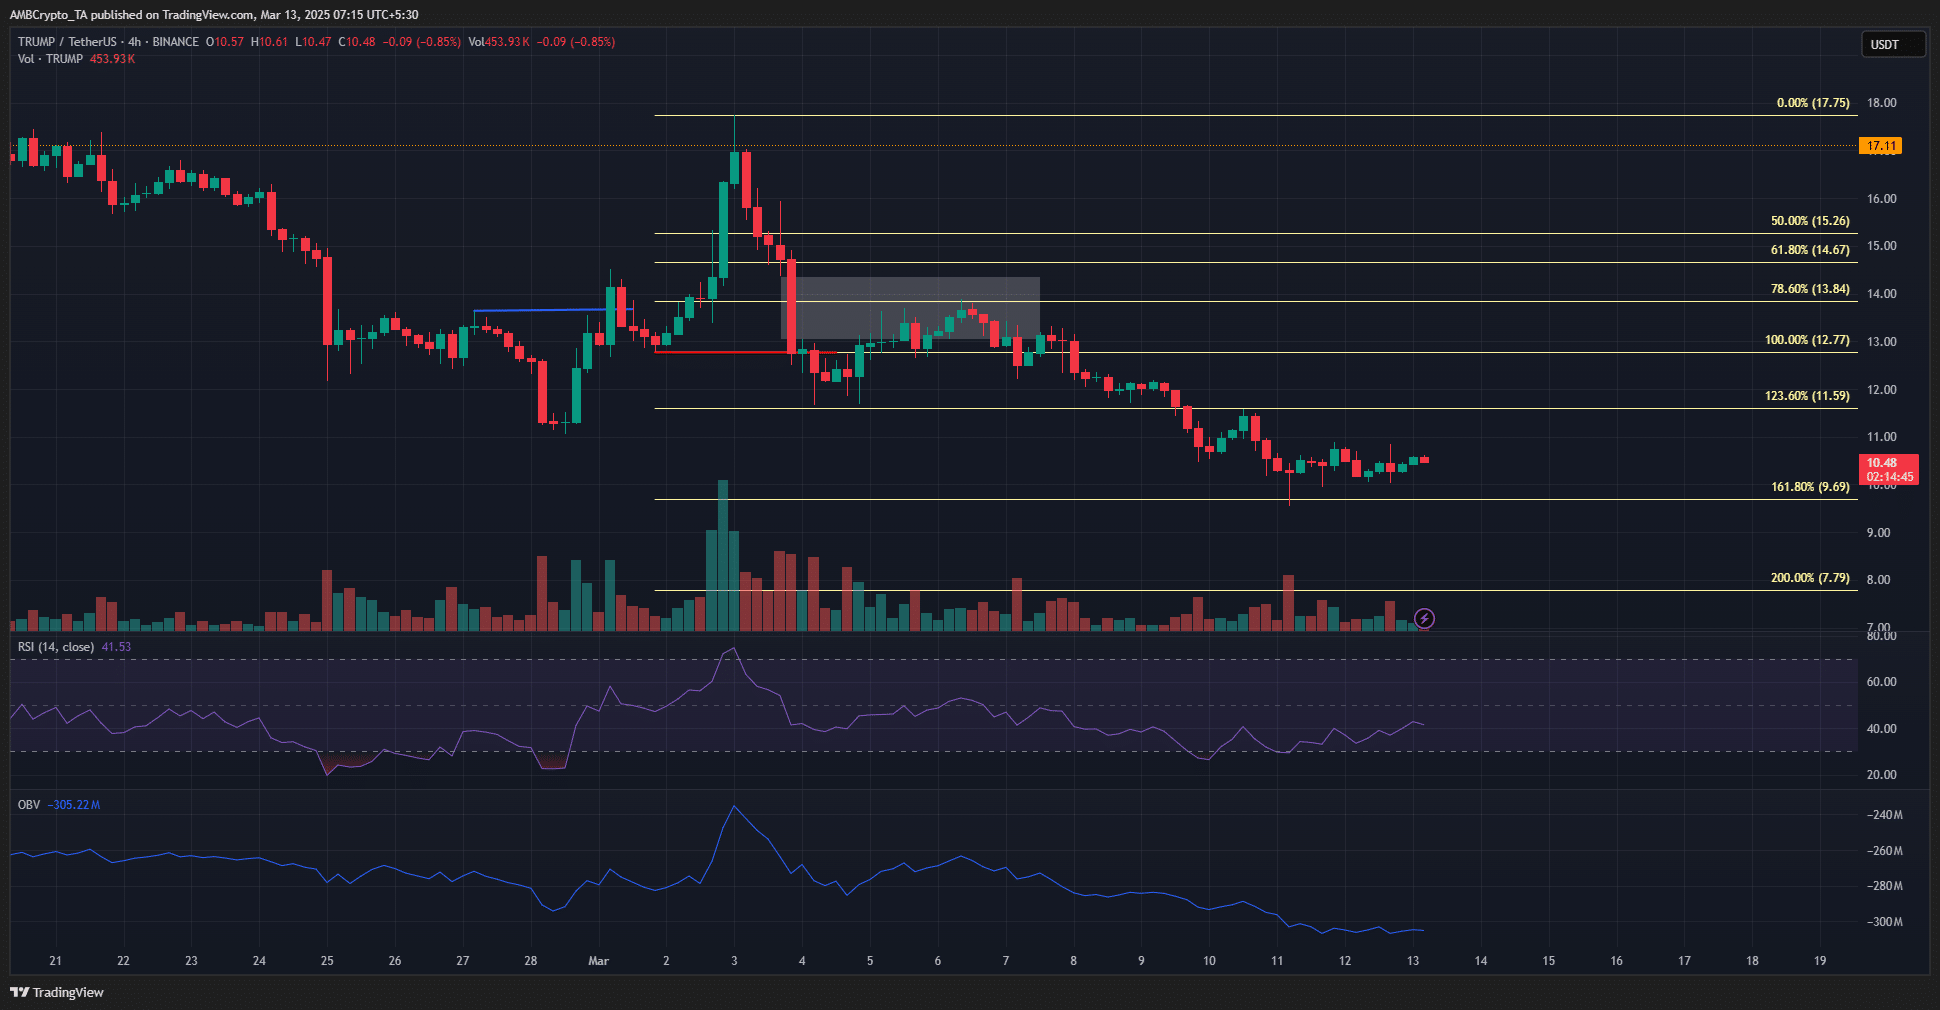
Towards the end of February, the market structure flipped bullishly (blue), and the price retested the local highs aroudn $18 before facing a brutal rejection. The swiftness of the drop left a fair value gap (white box).
This resistance lined up with the 78.6% retracement level. These levels were plotted based on the upward move that followed the bullish structure break. And, their extension levels remain valid even now.
The OBV has been on a steady downtrend alongside the price, highlighting the emphatic selling pressure. The RSI was also below zero, although it formed a bullish divergence with the price over the last two days.
Therefore, a price bounce can be expected. It could leap as high as the recent lower high at $11.59, before retracing. A market structure shift would occur on a 4-hour trading session close above $11.59. Here, it must be remembered that the swing structure of TRUMP has remained bearish. And, the $13.84-level is the one that must be broken to change this idea around.
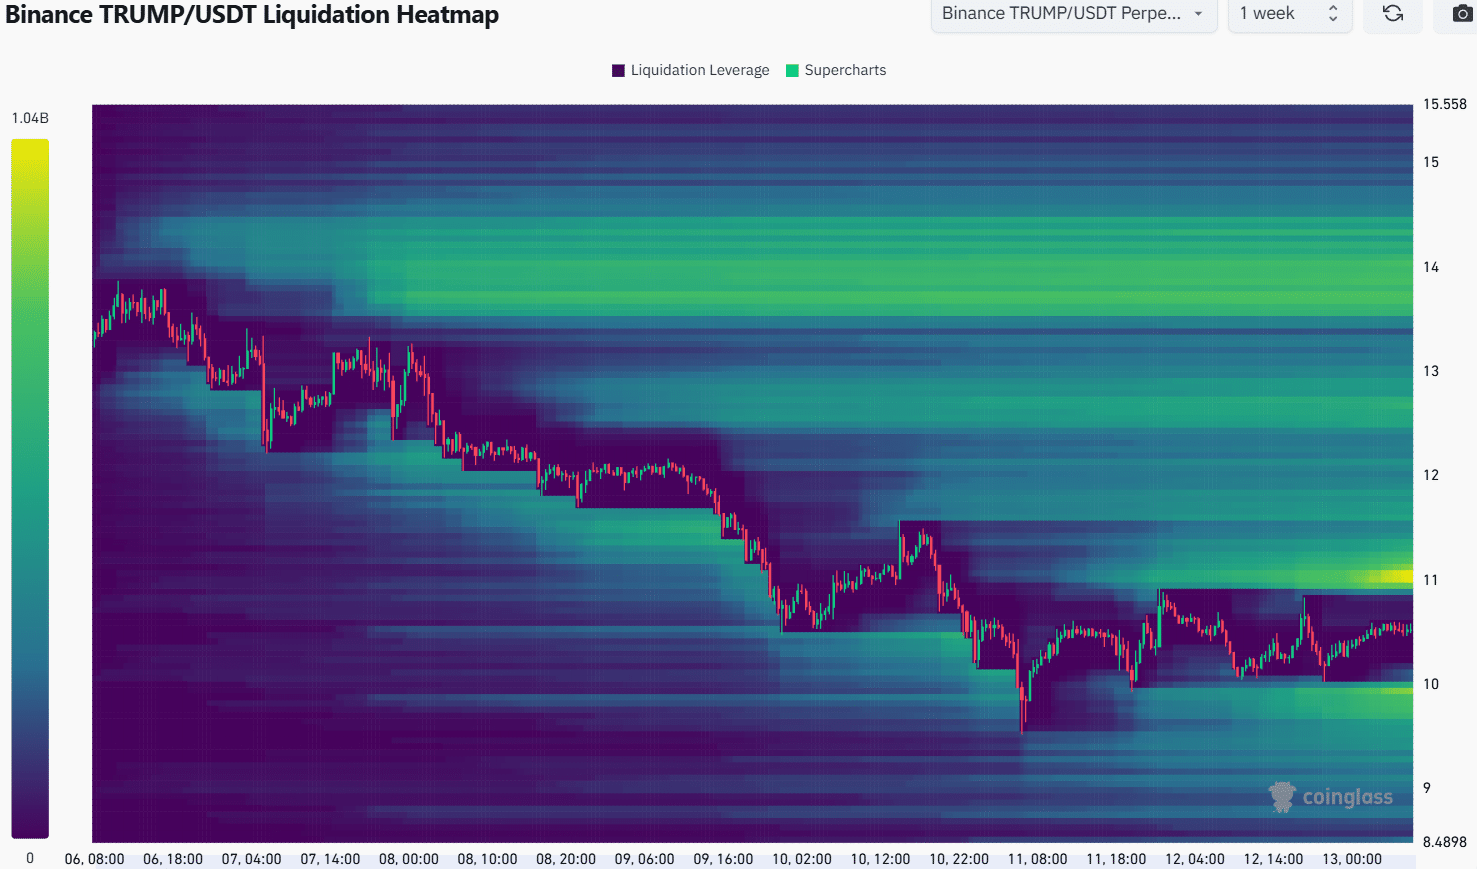
The 1-week liquidation heatmap revealed the possibility of a bearish reversal at the $11-level. The cluster of liquidation levels here could be visited before a move south to collect the liquidity at $10, before the next move can play out.
Beyond $11, the $12.82 and $14-levels are ones to watch out for in case TRUMP manages to break out beyond $11.6. Until then, the bias can remain bearish in the lower timeframes.
Disclaimer: The information presented does not constitute financial, investment, trading, or other types of advice and is solely the writer’s opinion