Assessing the odds of Jupiter [JUP] climbing above $2 thanks to THIS pattern
![Assessing the odds of Jupiter [JUP] climbing above $2 thanks to THIS pattern](https://ambcrypto.com/wp-content/uploads/2024/11/Why-Jupiter-might-touch-2-1200x686.webp)
- Jupiter might be forming another bullish flag pattern on the charts soon
- Token could face a liquidation barrier near the $1.2-level
Jupiter [JUP] has been consolidating for a few days now, with its price movement on the charts being fairly marginal. However, there may be more to the story here as the altcoin quietly climbed above yet another bullish pattern.
Will this be the trigger that’ll push the token to $2 in the coming days?
Jupiter’s secret plan
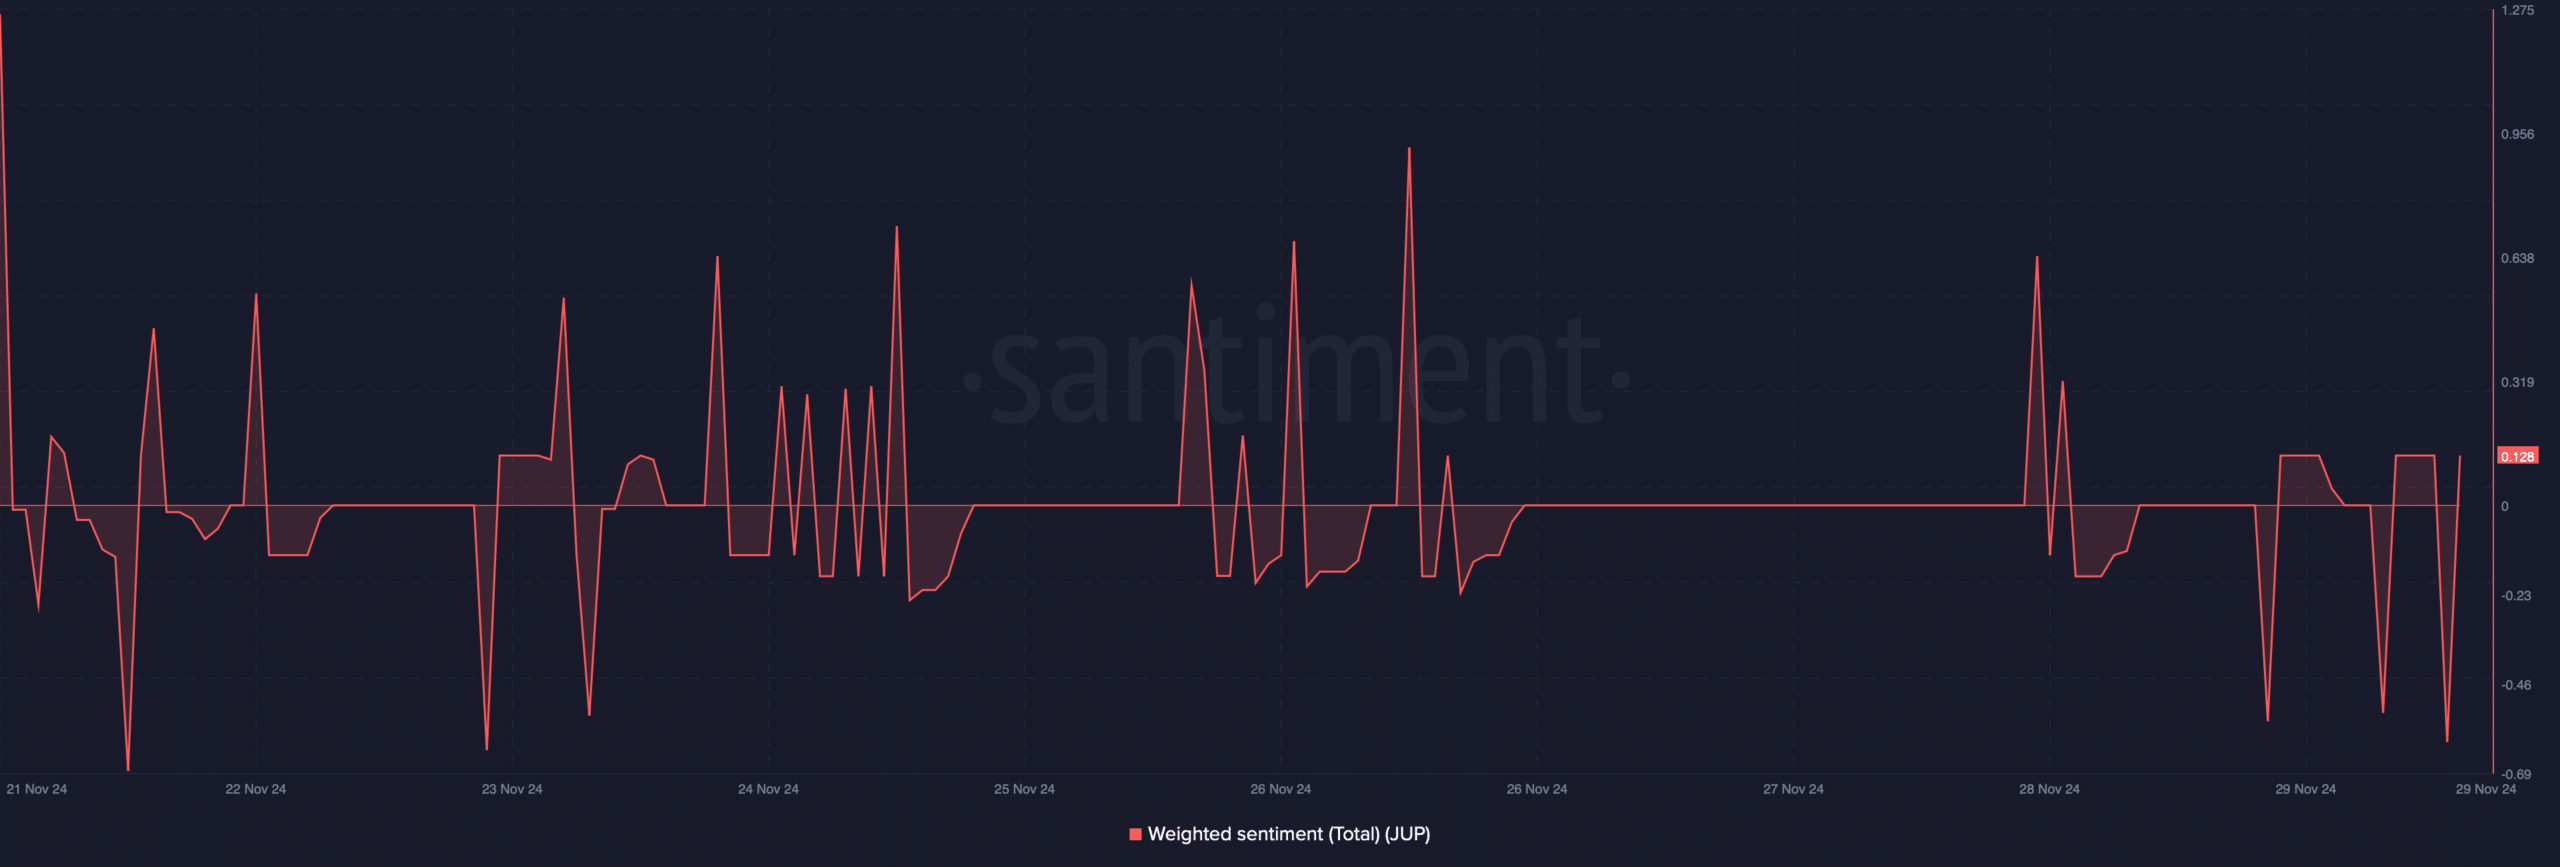
Thanks to the crypto’s recent bout of consolidation, its drop in volatility had a negative impact on its social metrics. In fact, the token’s weighted sentiment declined sharply – A sign of increasing bearish sentiment across the market.
However, investors shouldn’t be impatient, especially since Jupiter might have a trick up its sleeve too. World Of Charts, a popular crypto analyst, shared a tweet highlighting a very important update. According to the same, JUP silently broke above another pattern. This bullish falling wedge pattern emerged in the first week of November.
Since then, Jupiter’s price has consolidated inside it, only to breakout on 29 November. If the analysis is to be believed, this might allow the token to form another pattern, which has the potential to push JUP to $2 in the coming weeks.
What’s next for JUP?
To be precise, JUP might soon form a bullish flag pattern. If that happens, and JUP breaks out, it might hit $2. Therefore, investors might see JUP’s price drop after it first registers a few tall candlesticks. To see whether that’s possible, AMBCrypto assessed JUP’s on-chain data.
At the time of writing, there were more short positions in the market than long positions, with the same evidenced by the sharp decline in Jupiter’s long/short ratio. This can be attributed to the increasing bearish sentiment in the market because of JUP’s sluggish price action.
Nonetheless, the token’s Open Interest (OI) has also moved sideways lately. This suggested that investors’ interest in the token hasn’t been increasing much. And, this could trigger a trend reversal in the coming days.
On top of that, market indicators also supported the possibility of a bullish trend reversal.
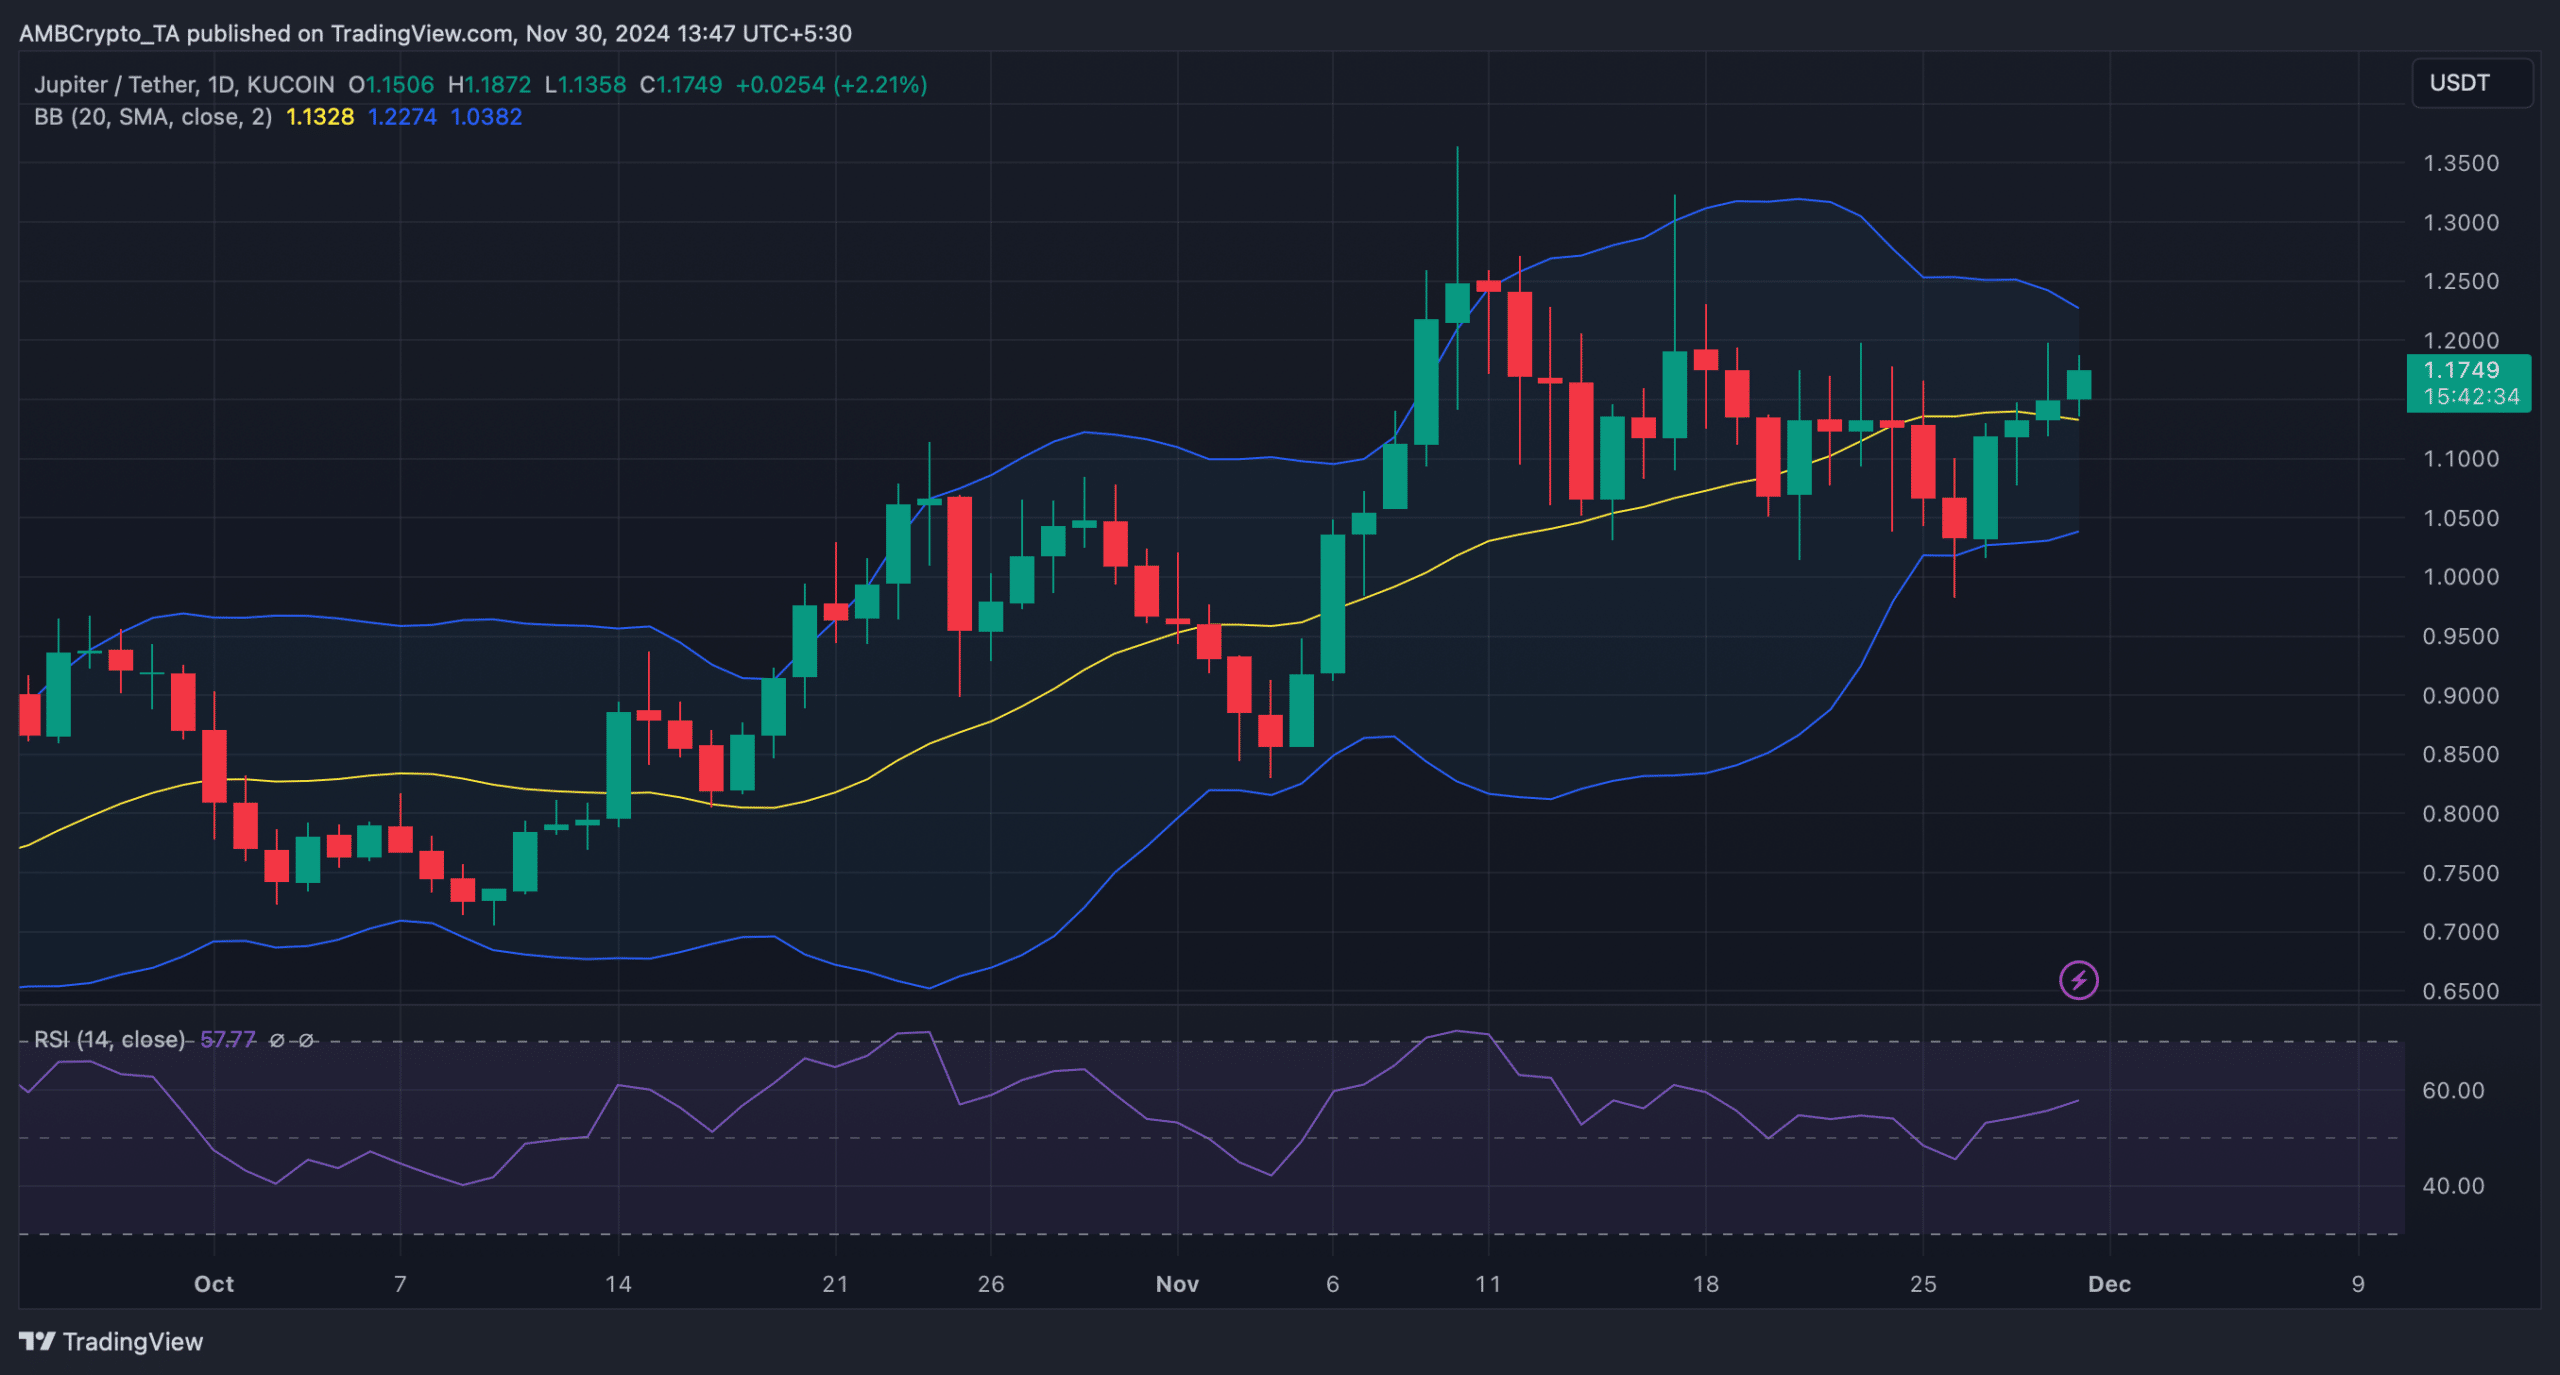
For instance – The Relative Strength Index (RSI) has been moving north, indicating a rise in buying pressure. Jupiter’s price seemed to be testing the support at its 20-day SMA too. In the event of a successful test, supported by high buying pressure, it won’t be ambitious to expect a fresh bull rally, before it forms a bullish flag.
Realistic or not, here’s JUP’s market cap in SOL terms
However, the token will face a crucial barrier going forward.
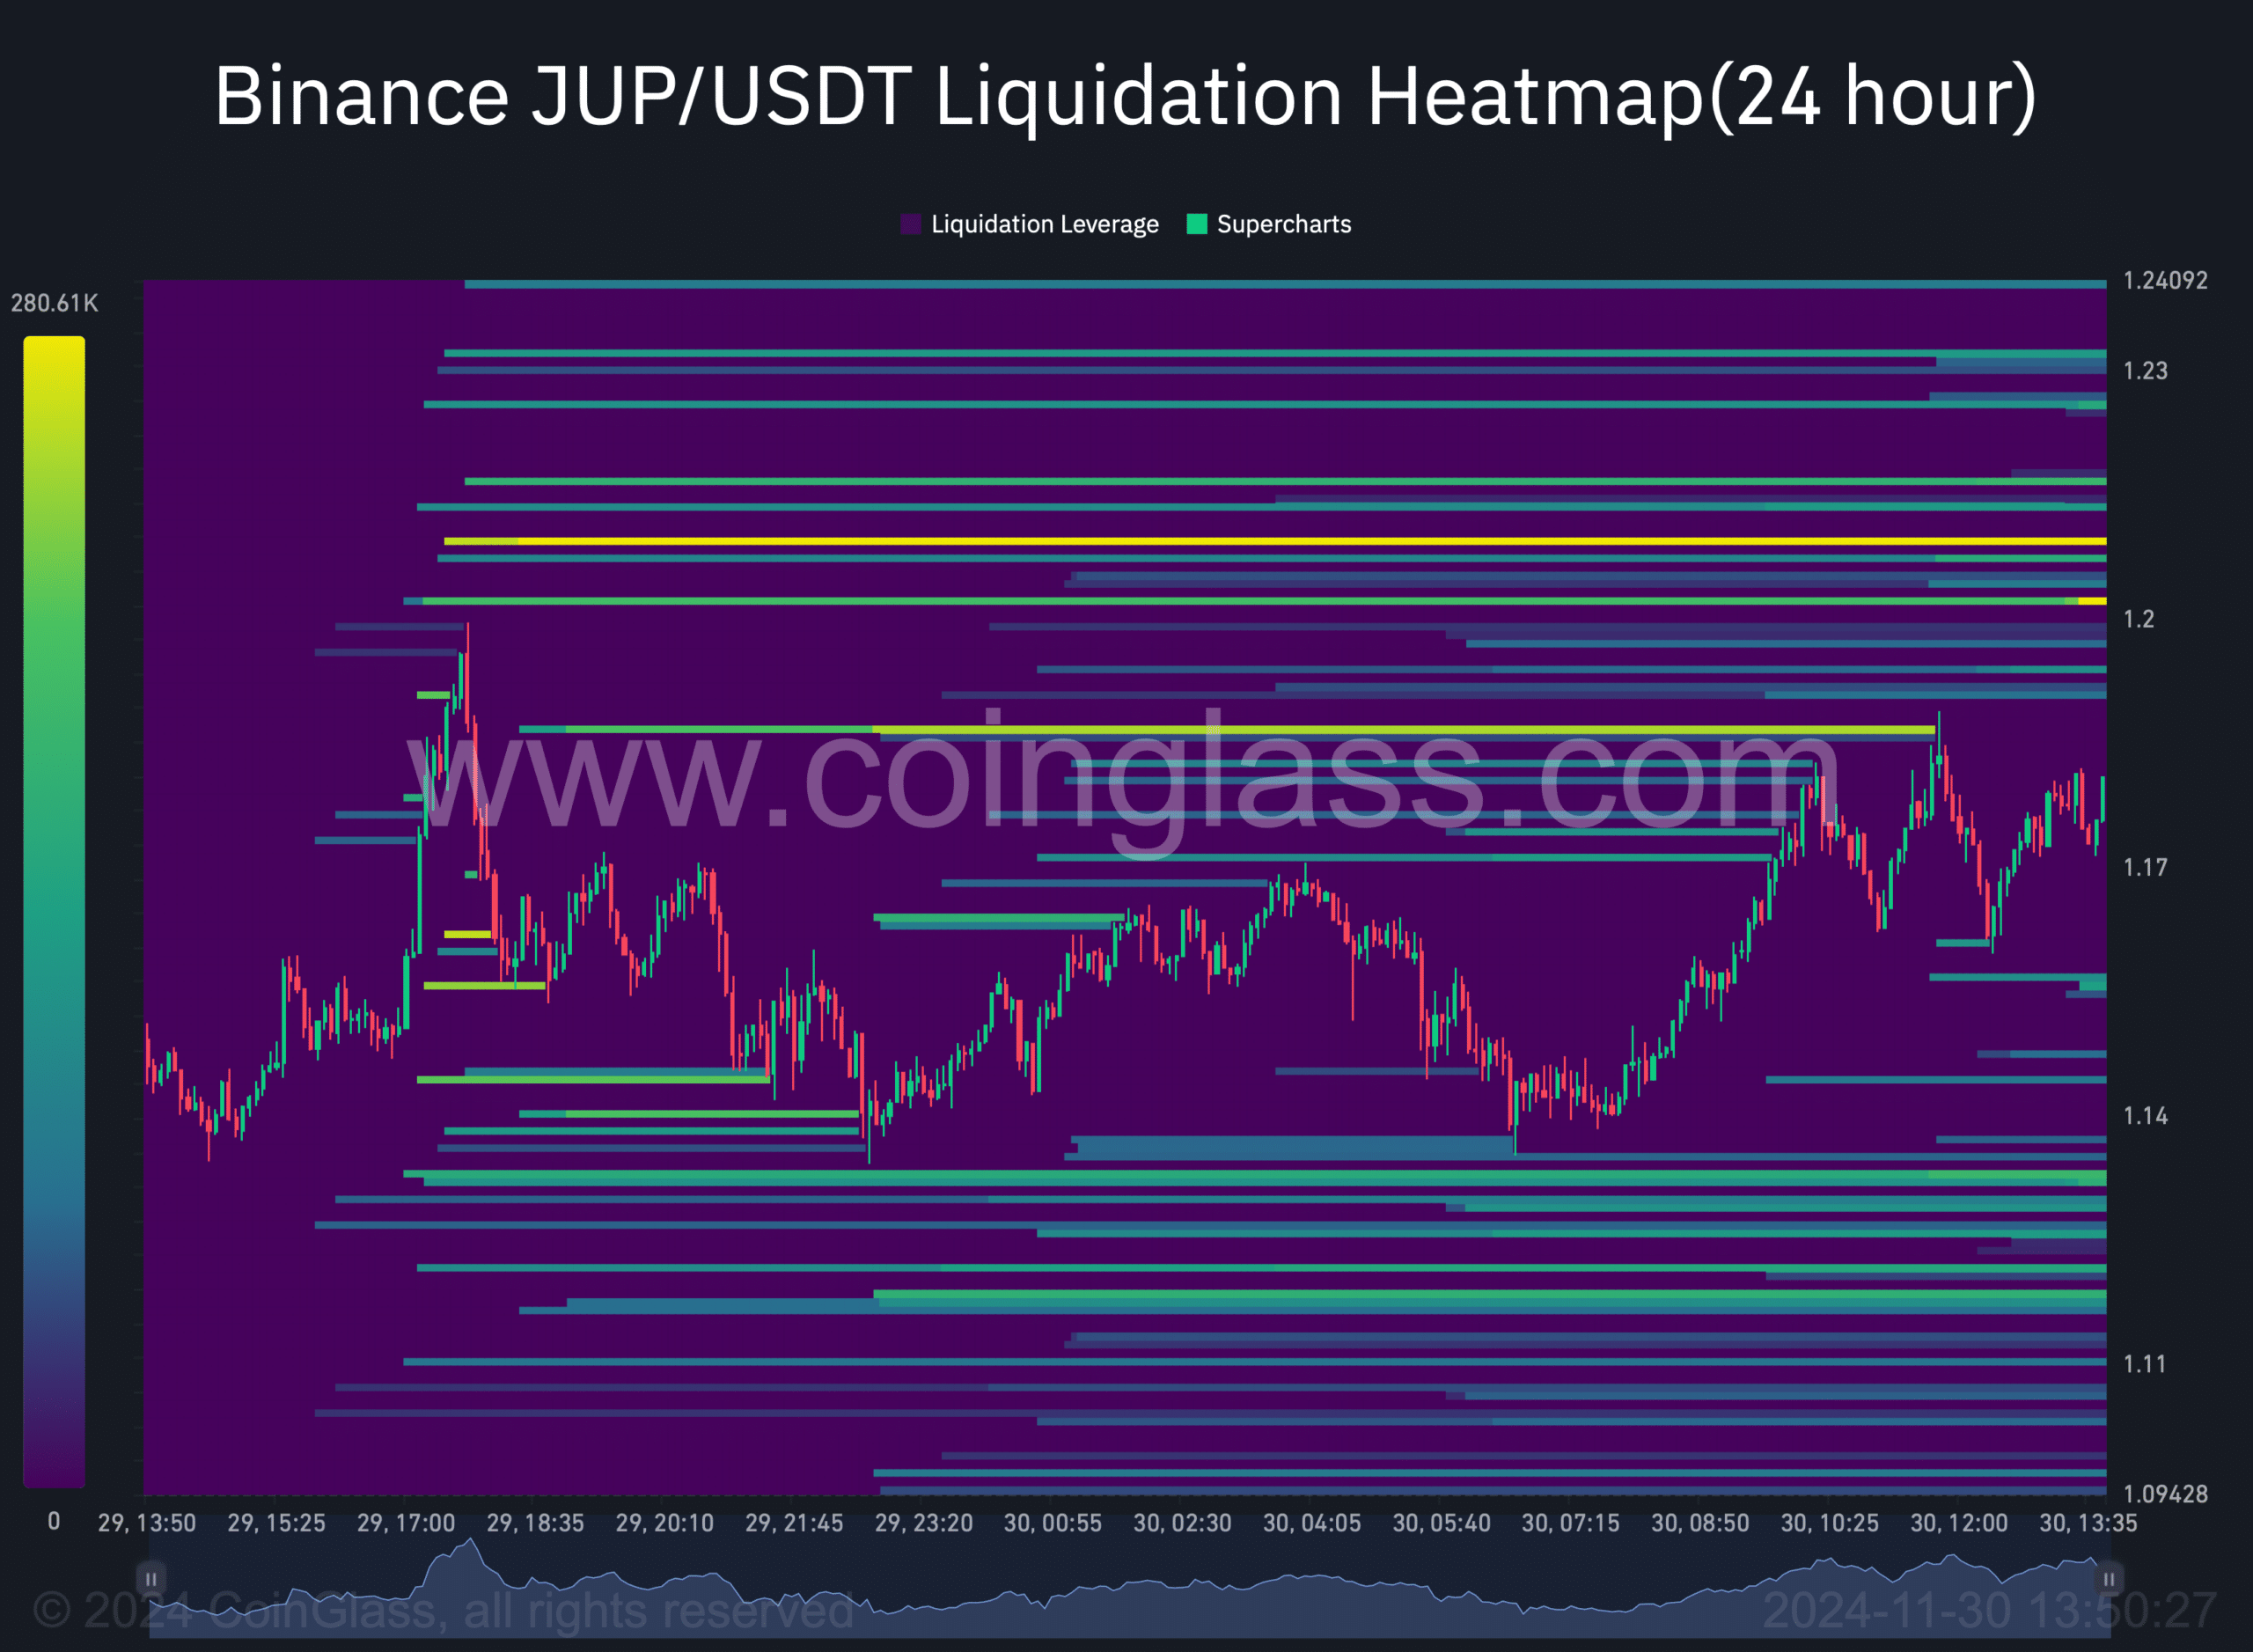
Jupiter’s liquidation heatmap revealed that the token’s liquidations will rise sharply near $1.2. Generally, high liquidation results in price corrections. Therefore, it must jump above that level to eye $2 in the near future.


![Kaspa [KAS] on a long-term downtrend? Here's why it should worry investors!](https://ambcrypto.com/wp-content/uploads/2025/06/Kaspa-Featured-400x240.webp)


