Jupiter has emerged as the top decentralized exchange aggregator in the Solana ecosystem, becoming a key liquidity routing engine in the DeFi space. The protocol was developed in 2021 by the anonymous developer Meow, with the goal of resolving one of the most common inefficiencies in DeFi – The lack of centralized liquidity.

Overall, Jupiter serves as a key part of Solana’s dynamic trading landscape, offering traders access to the most competitive swap rates and ensuring minimal slippage.

Jupiter is not a decentralized exchange like the existing exchanges that are based on a single liquidity pool. Rather, it acts as a routing engine, performing a simultaneous scan of various platforms, dividing trades into various pools if needed to obtain the best price. As Solana’s DeFi growth continues, this is becoming more significant as more protocols vie for liquidity.

Consequently, Jupiter has evolved into a basic platform. Not only for retail traders, but also for advanced users who execute advanced strategies.

On 31 January 2024, the launch of the JUP token was a major step in the development of the protocol. The token was issued via one of the largest airdrops in the Solana ecosystem, which saw around 1 billion tokens distributed to more than one million eligible wallets. This approach to distribution was community-based and further strengthened Jupiter’s decentralized, user-driven protocol.

An additional 700 million tokens were airdropped in early 2025, dubbed “Jupuary,” and contributed to an increase in community engagement and sustained participation.

Jupiter’s tokenomics are designed to break away from the traditional venture-backed models. The total supply will be 10 billion tokens, and it will be distributed based on a strict 50/50 formula between the community and the team. One-half of the supply will be allocated to airdrops, ecosystem incentives, and community efforts, with the other half going towards development, strategic growth, and protocol sustainability.

Importantly, there is a significant allocation of team members that are under long vesting periods, incentivizing long-term growth of the ecosystem over short-term extraction.

Furthermore, the cost-shifting model of Jupiter’s economy also relies on burn and buyback. The protocol has already burnt around 3 billion tokens, which is nearly 30% of the total tokens. Moreover, Jupiter applies half of its platform fee revenue towards token buybacks, creating a circular effect in which high trading volumes can affect token supply dynamics.

This will more closely reflect the value of tokens in relation to real platform usage, further establishing the correlation between adoption and economic sustainability.

However, Jupiter has developed beyond just tokenomics to become a comprehensive DeFi platform with various trading features. Although it is still largely focused on token swaps, the platform has expanded to incorporate more sophisticated trading options like limit orders, dollar-cost averaging and perpetual trading.

It has additionally invaded the launchpad space, permitting new initiatives within the Solana ecosystem to get liquidity and community help. This diversification enhances Jupiter’s status as not just an aggregator but as a key hub for DeFi activity.

Currently, Jupiter remains a significant player in the Solana decentralized trading ecosystem, and its ongoing development is vital for the future of the blockchain. It is an efficient liquidity aggregator and features a community-led token design and a growing product line – Making it a key part of the ecosystem.

In the evolving landscape of decentralized trading platforms, Jupiter’s future success will hinge on its ability to stay efficient with execution, scale its operations, and further engage its user base through its growing range of services.

VIEW MORE

Overview

Market Cap
$664.53M
+1.5%
Volume (24H)
$28.59M
Volume (7D)
$177.54M
-1.1%
Max Supply
10,000,000,000 JUP
Circulating Supply
3,320,312,968 JUP
All-Time High
$2.00
-90.0%
All-Time Low
$0.135801
+47.4%
(above ATL)

Prediction Analysis

Current Price
$0.20
Sentiment
Neutral
50-Day SMA
$0.20
Price Prediction
$0.08
-60.40%
Fear & Greed Index
200-Day SMA
$0.19
Green Days
15 / last 30 (51.7%)
Volatility
4.09%
Moderate
14-Day RSI
24.50
Oversold

Profit Calculator

Select asset
%
%
Total Profit
$0
(0%)
Total Exit Amount
$0
Total Investment Fee
$0
Total Exit Fee
$0

Jupiter Price Prediction

Current Price
$0.20
2031
$0.00
2036
$0.00
2041
$0.00
2046
$0.00

Results are based solely on your predicted price change. They are not indicators of future performance and do not take into account different performance scenarios, historical data, or the effect of fees or other charges.

VIEW MORE

Short-Term Jupiter Price Targets

Date Prediction Change
Jul 22, 2026 $0.21 +4.94%
Jul 23, 2026 $0.22 +10.12%
Jul 24, 2026 $0.23 +15.56%
Jul 25, 2026 $0.24 +21.26%
Jul 26, 2026 $0.25 +27.25%
Jul 27, 2026 $0.27 +33.53%
Jul 28, 2026 $0.28 +40.13%

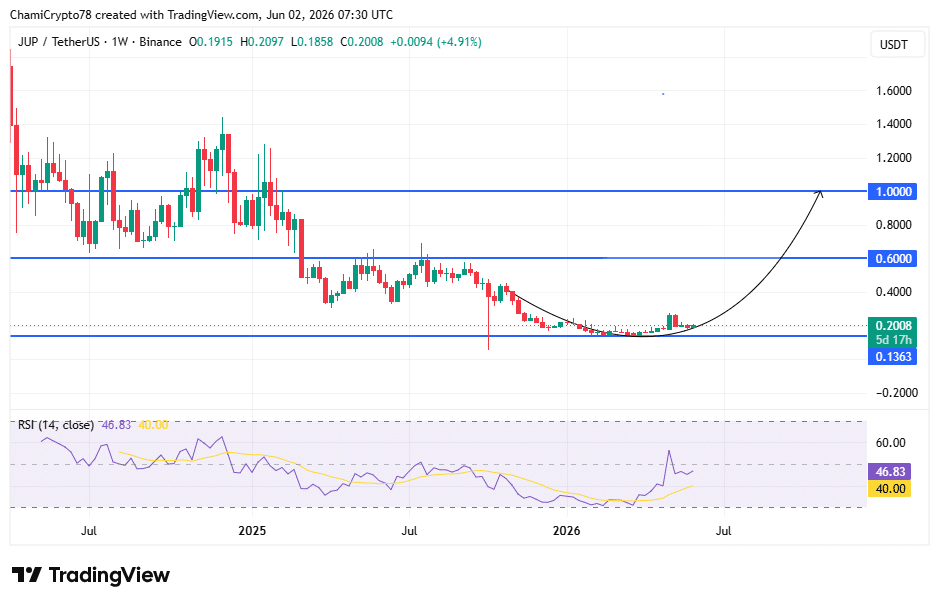
In the short term, JUP has been attempting to stabilize after an extended downtrend, with the price consolidating around the $0.20-support level in early June 2026. The weekly structure suggested that a breakout from the descending trendline could initiate a recovery phase, particularly if the price successfully reclaims the $0.60-resistance zone. This level would serve as the first confirmation of sustained bullish strength. If momentum continues to build and buying pressure increases, JUP could extend its move towards the $1.00-target. However, failure to hold above the press time support would likely delay this recovery and keep the price within its existing consolidation range.

VIEW MORE

Monthly Jupiter Price Prediction

Jun 30, 2026
$0.21
Jul 21, 2026
$0.20
Highest in Jul
$0.25
Lowest in Jul
$0.19
Overall Performance
Falling

Long-Term Jupiter Price Prediction

Month Price AVG Price Max Price Change
Jul $0.23 $0.21 $0.21 +14.91%
Aug $0.26 $0.24 $0.24 +29.90%
Sep $0.29 $0.28 $0.28 +44.89%
Oct $0.34 $0.32 $0.32 +69.87%
Nov $0.38 $0.36 $0.36 +89.86%
Dec $0.43 $0.41 $0.41 +114.84%
Over the long term, JUP’s outlook remains closely tied to its position within the Solana DeFi ecosystem and its ability to sustain user growth and trading activity. At the time of writing, the broader chart structure suggested that the current accumulation phase could serve as a foundation for a larger upward move, particularly if key resistance levels are gradually reclaimed. A confirmed break above the $1.00-level would signal a transition into a stronger bullish structure, potentially paving the way towards the $2.00 long-term target. This progression would depend on sustained ecosystem expansion and demand for Jupiter’s liquidity aggregation services.
VIEW MORE

Historical Price Performance

Year Highest Price Lowest Price
2026 (to date) $0 $0
2025 $1 $0
2024 $2 $0

Since its launch in early 2024, JUP has registered strong initial volatility driven by airdrop-related activity and speculative trading. The price surged rapidly during its early trading phase before entering a prolonged correction period as early holders took profits. Throughout 2024 and into 2025, JUP formed a series of lower highs, reflecting sustained selling pressure and a broader market cooldown. This decline eventually led price into its current accumulation range near $0.20. Despite the extended downtrend though, recent price action has hinted at stabilization - A sign that selling pressure may have eased and that the market may be preparing for a potential recovery phase.

VIEW MORE

Technical Analysis

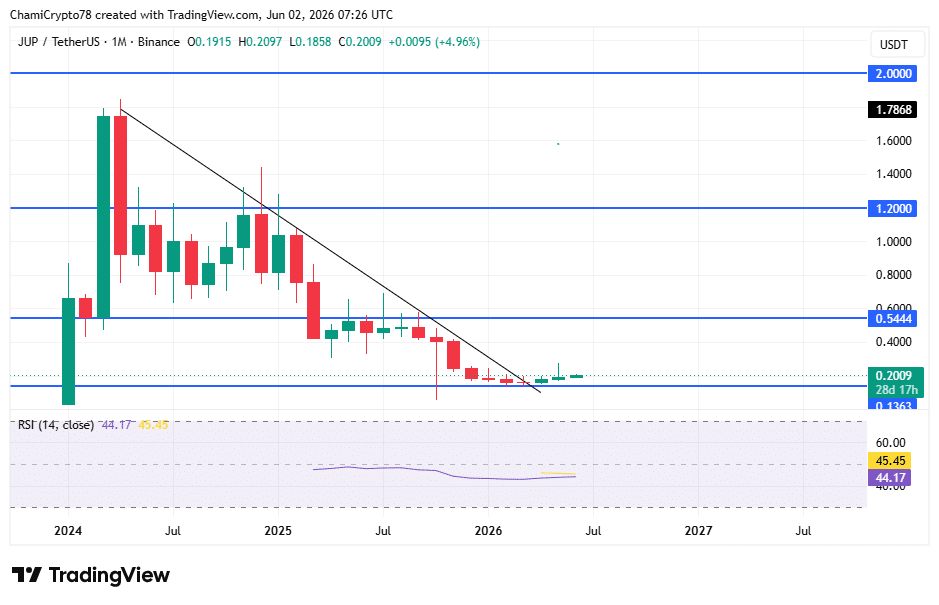
JUP has remained under sustained downward pressure since its early post-launch highs, forming a clear descending structure on both the monthly and weekly charts. The monthly timeframe revealed the price compressing into a long-term support zone around $0.13–$0.20 – An area that has historically attracted consistent buying interest. This base formation suggested that selling pressure has gradually weakened, allowing accumulation to take place within a defined range.

Source: JUP/USDT, TradingView

On the weekly chart, the price recently stabilized near $0.20 and seemed to be attempting to break out of its descending trendline. This structure reflected a potential shift from a bearish trend into an early-stage recovery phase. Resistance levels seemed to be positioned at $0.60 and $1.00, with $0.60 acting as the first confirmation level for bullish continuation. A successful move above this zone would likely open the path to the $1.00-target.

RSI readings across both timeframes were near neutral levels too, indicating that JUP was neither overbought nor oversold. However, at press time, the RSI had begun to recover from previously weaker levels, suggesting that buying interest may be gradually returning.

Source: JUP/USDT, TradingView

If this trend continues alongside improving price structure, JUP could transition into a broader recovery phase supported by strengthening market participation.

Guides

How to Read Jupiter Charts and Predict Price Movements?

Most traders use candlestick charts, as they provide more information than a simple line chart. Traders can view candlesticks that represent the price action of Jupiter with different granularity – for example, you could choose a 5-minute candlestick chart for extremely short-term price action or choose a weekly candlestick chart to identify long-term trends. 1-hour, 4-hour, and 1-day candlestick charts are among the most popular.

Let’s use a 1-hour candlestick chart as an example of how this type of price chart gives us information about opening and closing prices. The chart is divided into “candles” that give us information about Jupiter’s price action in 1-hour chunks. Each candlestick will display the asset’s opening price, closing price, as well as the highest and lowest prices reached within that period.

Jupiter Price Prediction Indicators

Moving averages are among the most popular Jupiter price prediction tools. As the name suggests, a moving average provides the average closing price over a selected time frame, which is divided into a number of periods of the same length. For example, a 12-day simple moving average is calculated by summing the closing prices over the last 12 days and dividing the result by 12.

In addition to the simple moving average (SMA), traders also use another type of moving average called the exponential moving average (EMA). The EMA gives more weight to recent prices, and therefore reacts more quickly to changes in market conditions.

What Affects the Price of Jupiter?

Just like with any other asset, the price action of Jupiter is driven by supply and demand. These dynamics can be influenced by fundamental events such as block reward halvings, hard forks, or new protocol updates. Regulations, adoption by companies and governments, cryptocurrency exchange hacks, and other real-world events can also affect market sentiment.

Technical indicators such as moving averages, RSI, and trading volume are also used by traders to anticipate price movements and identify potential trend reversals.

FAQs on Jupiter Price Predictions

As of today, Jupiter (JUP) is trading at $0.200151. The current market sentiment is Neutral, with RSI at 24.5 (Oversold) and volatility classified as Moderate.
Based on our technical analysis and projected annual growth rate, Jupiter could reach $0.07926 by 2027. This estimate assumes continued market momentum and adoption trends.
According to our technical analysis indicators, the Jupiter price prediction is forecasted to reach $0.001949 within the next five years (by 2031). Over the last 30 days, Jupiter recorded green days 52% of the time.
Based on multiple technical indicators, the current outlook for Jupiter in 2026 is Neutral. RSI currently sits at 24.5, which indicates Oversold momentum. However, investors should evaluate both technical signals and fundamental developments before making any investment decisions.
Long-term forecasts indicate that Jupiter may continue to grow over the next decade if adoption, technology development, and global crypto demand continue to expand.
While Jupiter's future value depends on various factors, technical indicators suggest it could experience both bullish and bearish cycles over time. Long-term investors typically monitor RSI levels, moving averages, and broader market sentiment when evaluating JUP's future trajectory.
Disclaimer

AMBCrypto's content is meant to be informational in nature and should not be interpreted as investment advice. Trading, buying or selling cryptocurrencies should be considered a high-risk investment and every reader is advised to do their own research before making any decisions.