Assessing the odds of SAND reaching $1 in the coming week

Binance U.S. confirmed that the exchange will be adding the Sandbox [SAND] token on the platform. This news was also retweeted by Sandbox on their Twitter account. Since the news broke, investors and SAND reacted positively to this announcement.
Furthermore, the trend appeared to be continuing as of 5 October. The price of SAND was approximately $0.81 at the start of trading on 4 October. However, SAND’s price stood at $0.83 by the end of the day, a gain of nearly 2%.
6-hour timeframe looks good
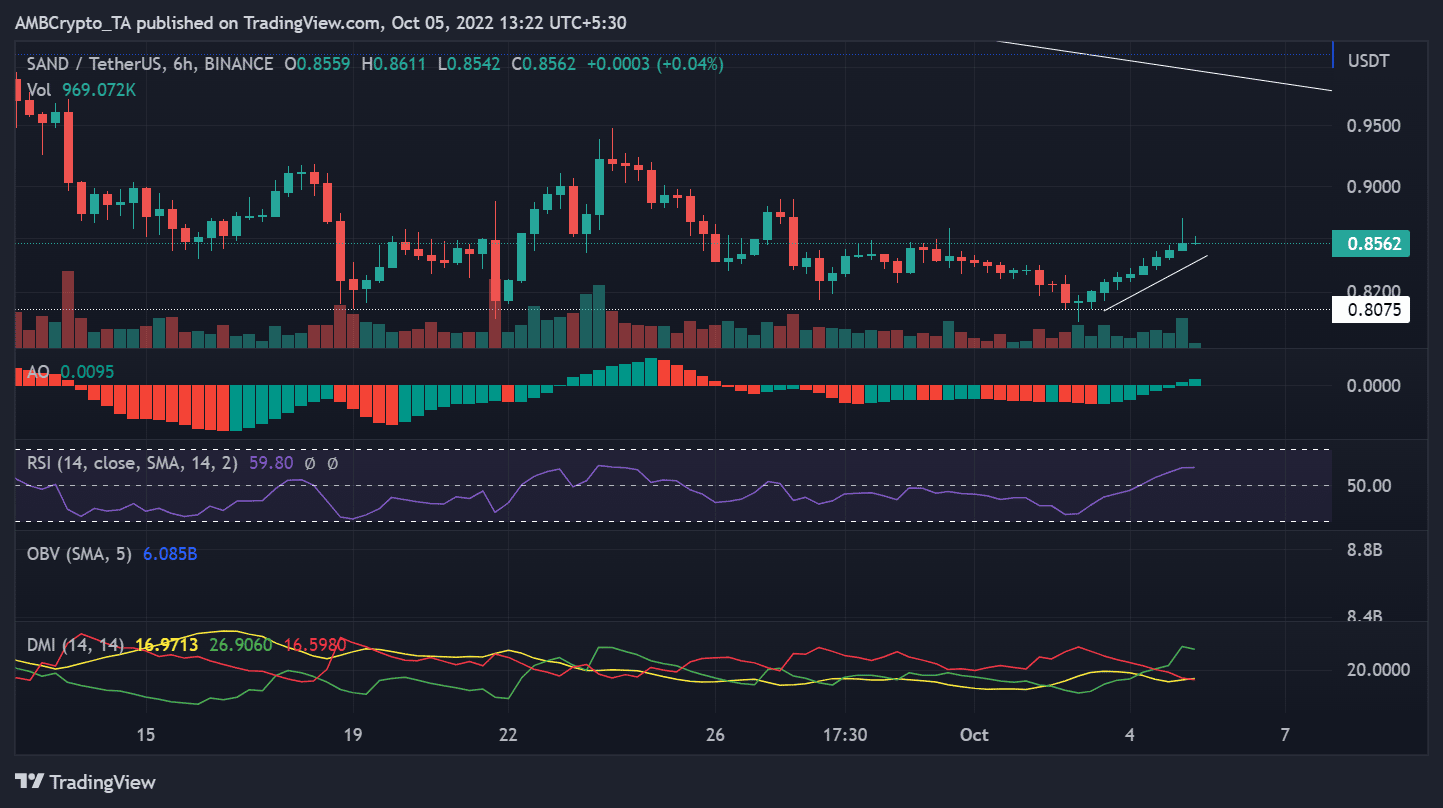
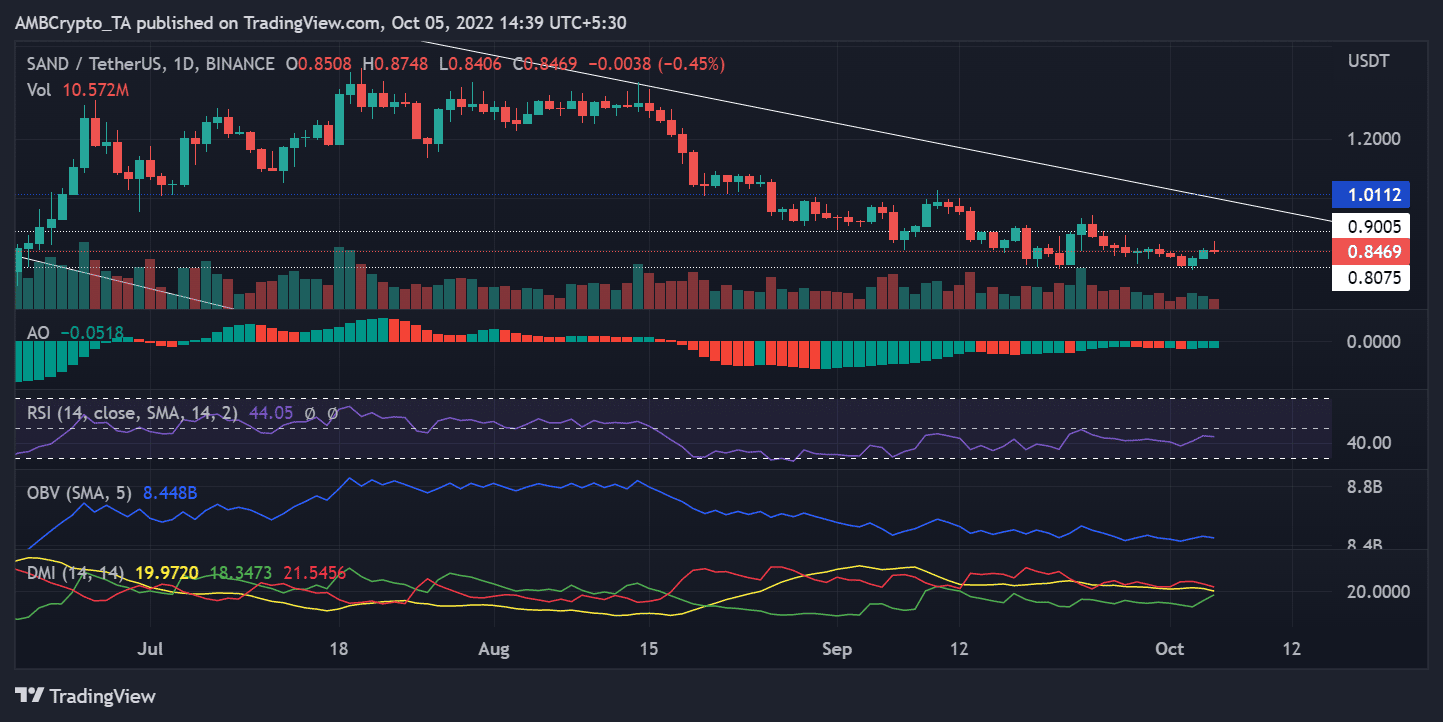
Looking at the price of SAND on a daily time frame with the aid of a trend line, we can see that the asset had been in a downward trend for some time now. On the contrary, the six-hour chart revealed an upward trend in price, most notably from 3 to 4 October.
The Awesome Oscillator (AO) crossed above the zero line, indicating a bullish trend for SAND within the six-hour timeframe.
Within the same time frame, bullish signals were also displayed by the Relative Strength Index (RSI), which was above its neutral line. Despite this, the strength of the two bullish trends for both indicators wasn’t convincing.
A daily time frame with a bear lurking
Support was identified at $0.807 on the daily time frame utilizing trendlines. The asset struggled to break through the $1.011 area of resistance for the entire month of September. In recent weeks, the barrier had lowered even further and stood at $0.90, at press time.
The AO revealed the asset’s activity below the zero line, indicating a mild bearish trend. The RSI was also below the neutral line, but it wasn’t too far below it. This indicated a bearish trend that wasn’t overly strong.
The signal and negative DI lines of the Directional Movement Index (DMI) were both far above 20, while the positive DI line was only slightly lower. This also pointed towards a mild bear trend, all on the daily time frame.
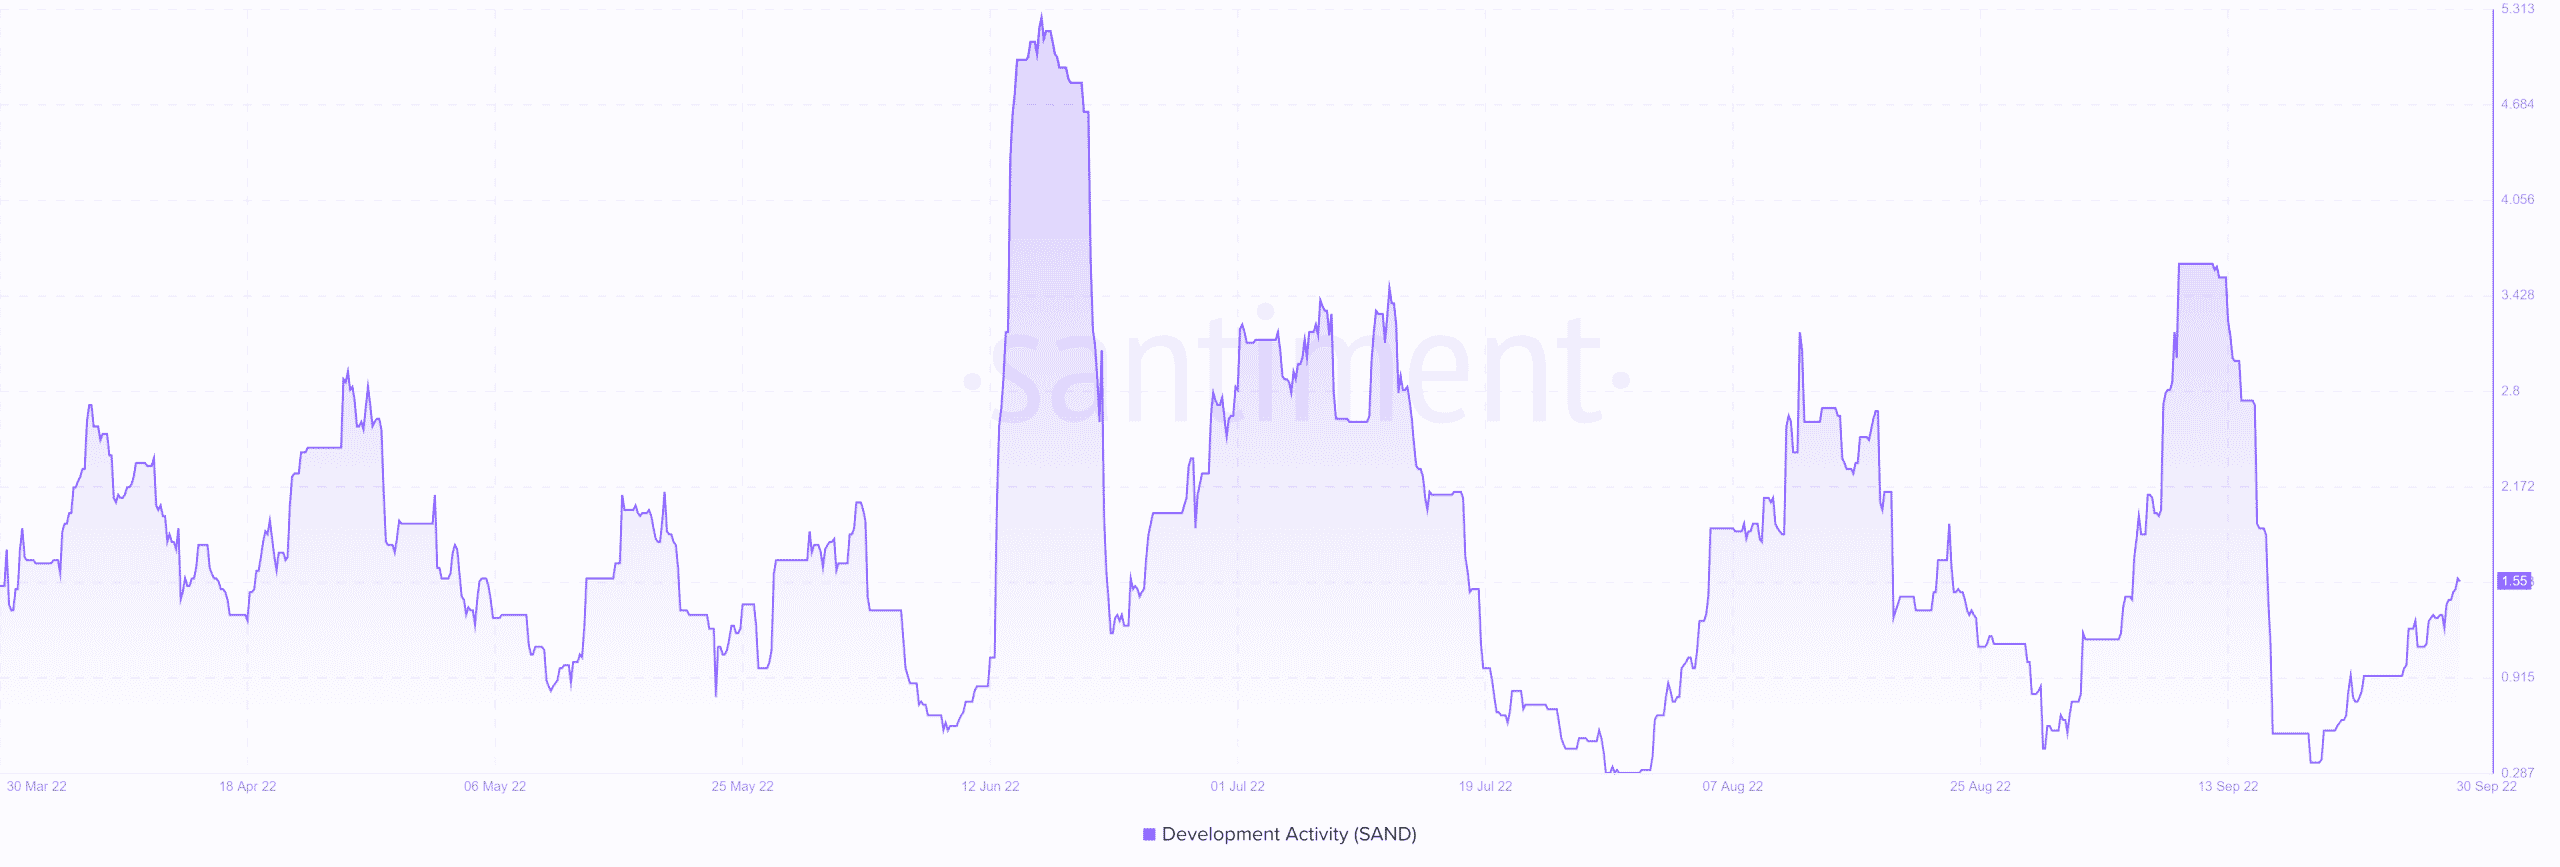
Additionally, according to Santiment’s developer activity metric, the development activity for SAND stood at 1.55. The chart showed a little upward trend, but overall, Sandbox’s development activity remained low.
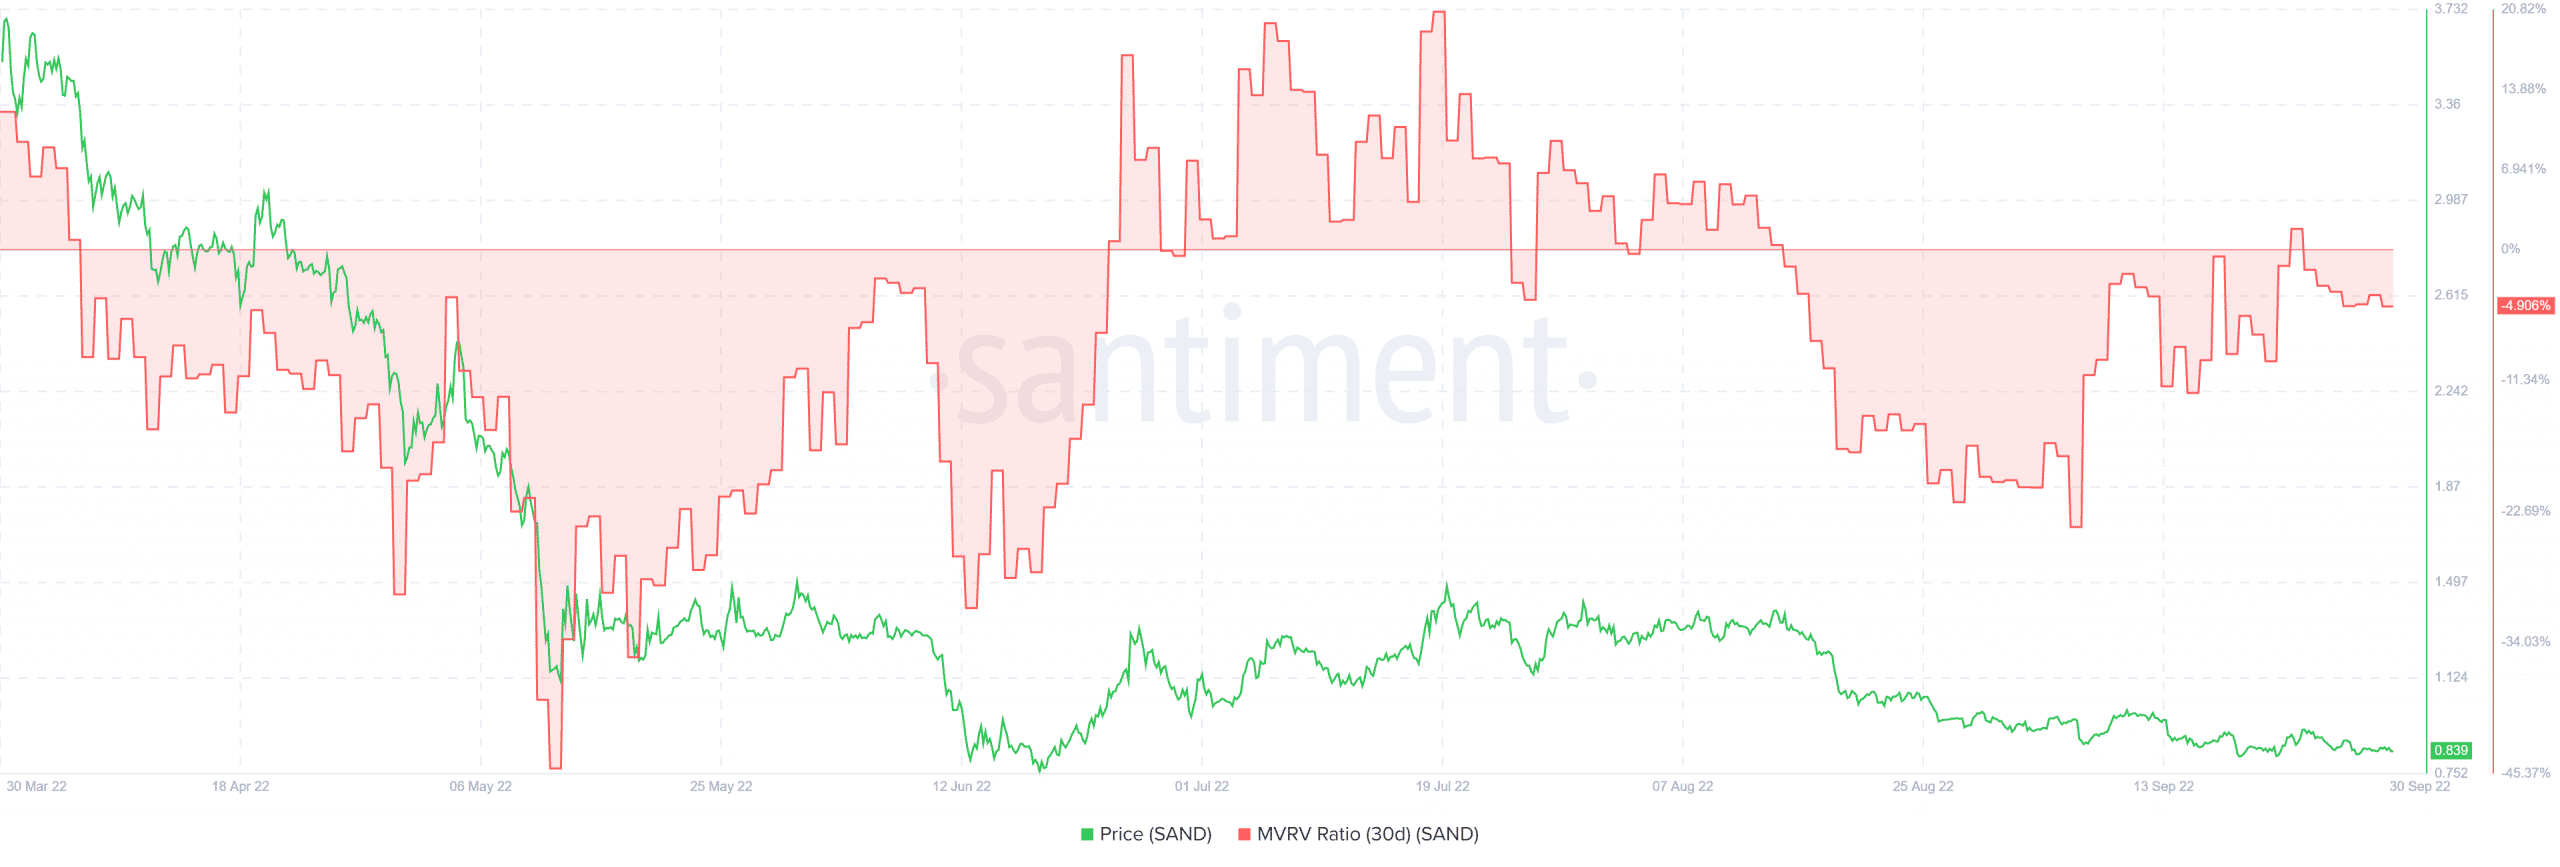
Further evidence that the asset was undervalued was provided by the Market Value to Realized Value Ratio (MVRV).
With more potential buyers now having access to SAND, buying activity should witness some growth. However, a rally to the $1 area may still be in question unless SAND decides to move out of its current price zone.
![Stellar [XLM] crypto price prediction 2030: What would it take to reach $1?](https://ambcrypto.com/wp-content/uploads/2026/07/Adewale-2-1-4-e1785263791517.webp)