Assessing what’s next for Yearn Finance (YFI) as we gear up to close Q4

- YFI suffers a bearish divergence that indicates a decline in buying momentum.
- Sellers take control of the YFI market during the intraday trading session.
Despite the growth in the price per Yearn Finance (YFI) token, the count of daily active addresses on the network continues to fall, data from Santiment revealed.
As of this writing, YFI traded at $7,027.16. In the last week, its price went up by 7%, per data from CoinMarketcap.
Read Yearn Finance (YFI) Price Prediction 2023-2024
With just 248 unique addresses involved in YFI transactions at press time, the number of daily active addresses that have traded the alt has fallen consistently by 41% in the last week.
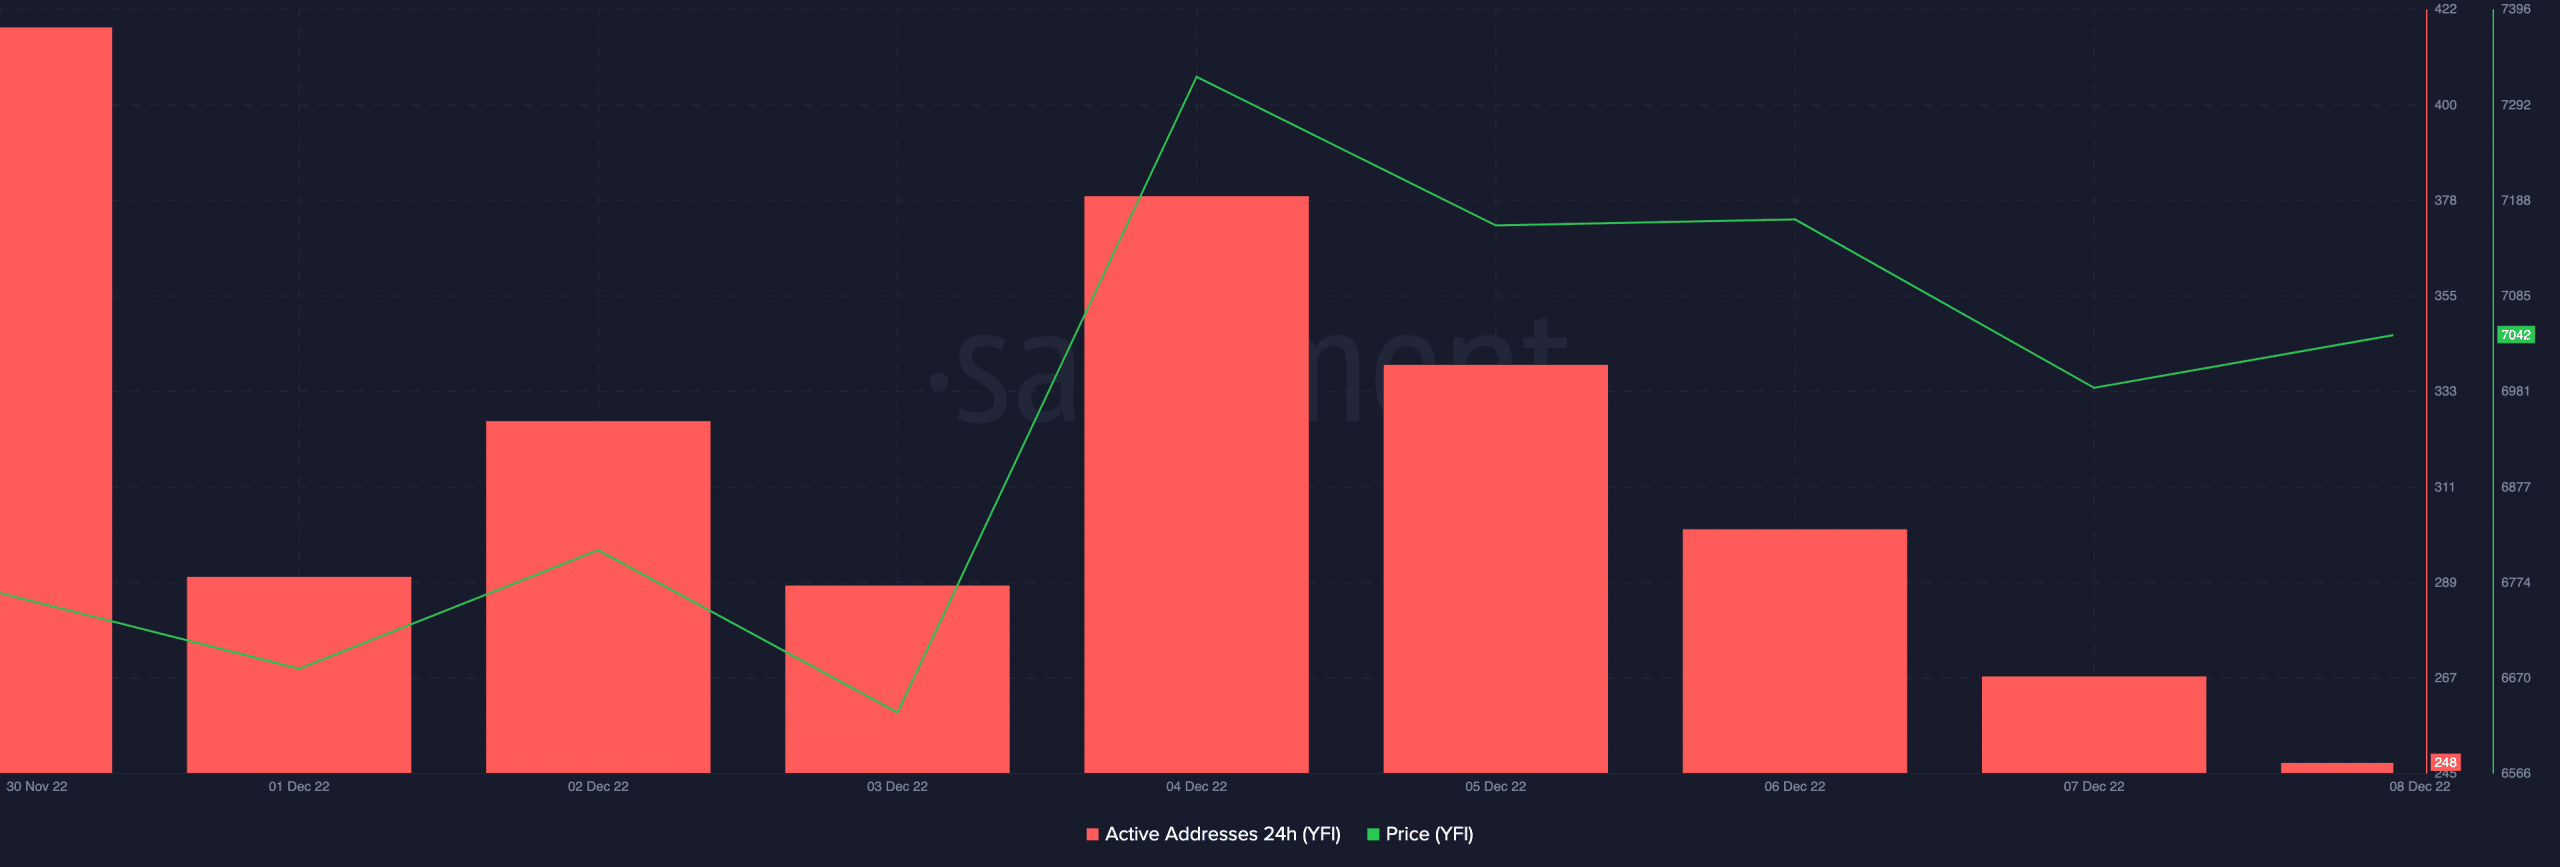
YFI’s price and the count of its active addresses moving in opposite directions create a bearish divergence that precedes a price drawdown.
Likewise, a price/trading volume divergence was spotted on a daily chart. As YFI’s price rallied by 3% in the last 24 hours, its trading volume fell by 25% within the same period.
This was an indication of exhaustion among the current buyers in the YFI market and marked a potential re-entrance point for sellers. As a result, new demand would be required to drive up the alt’s price further.
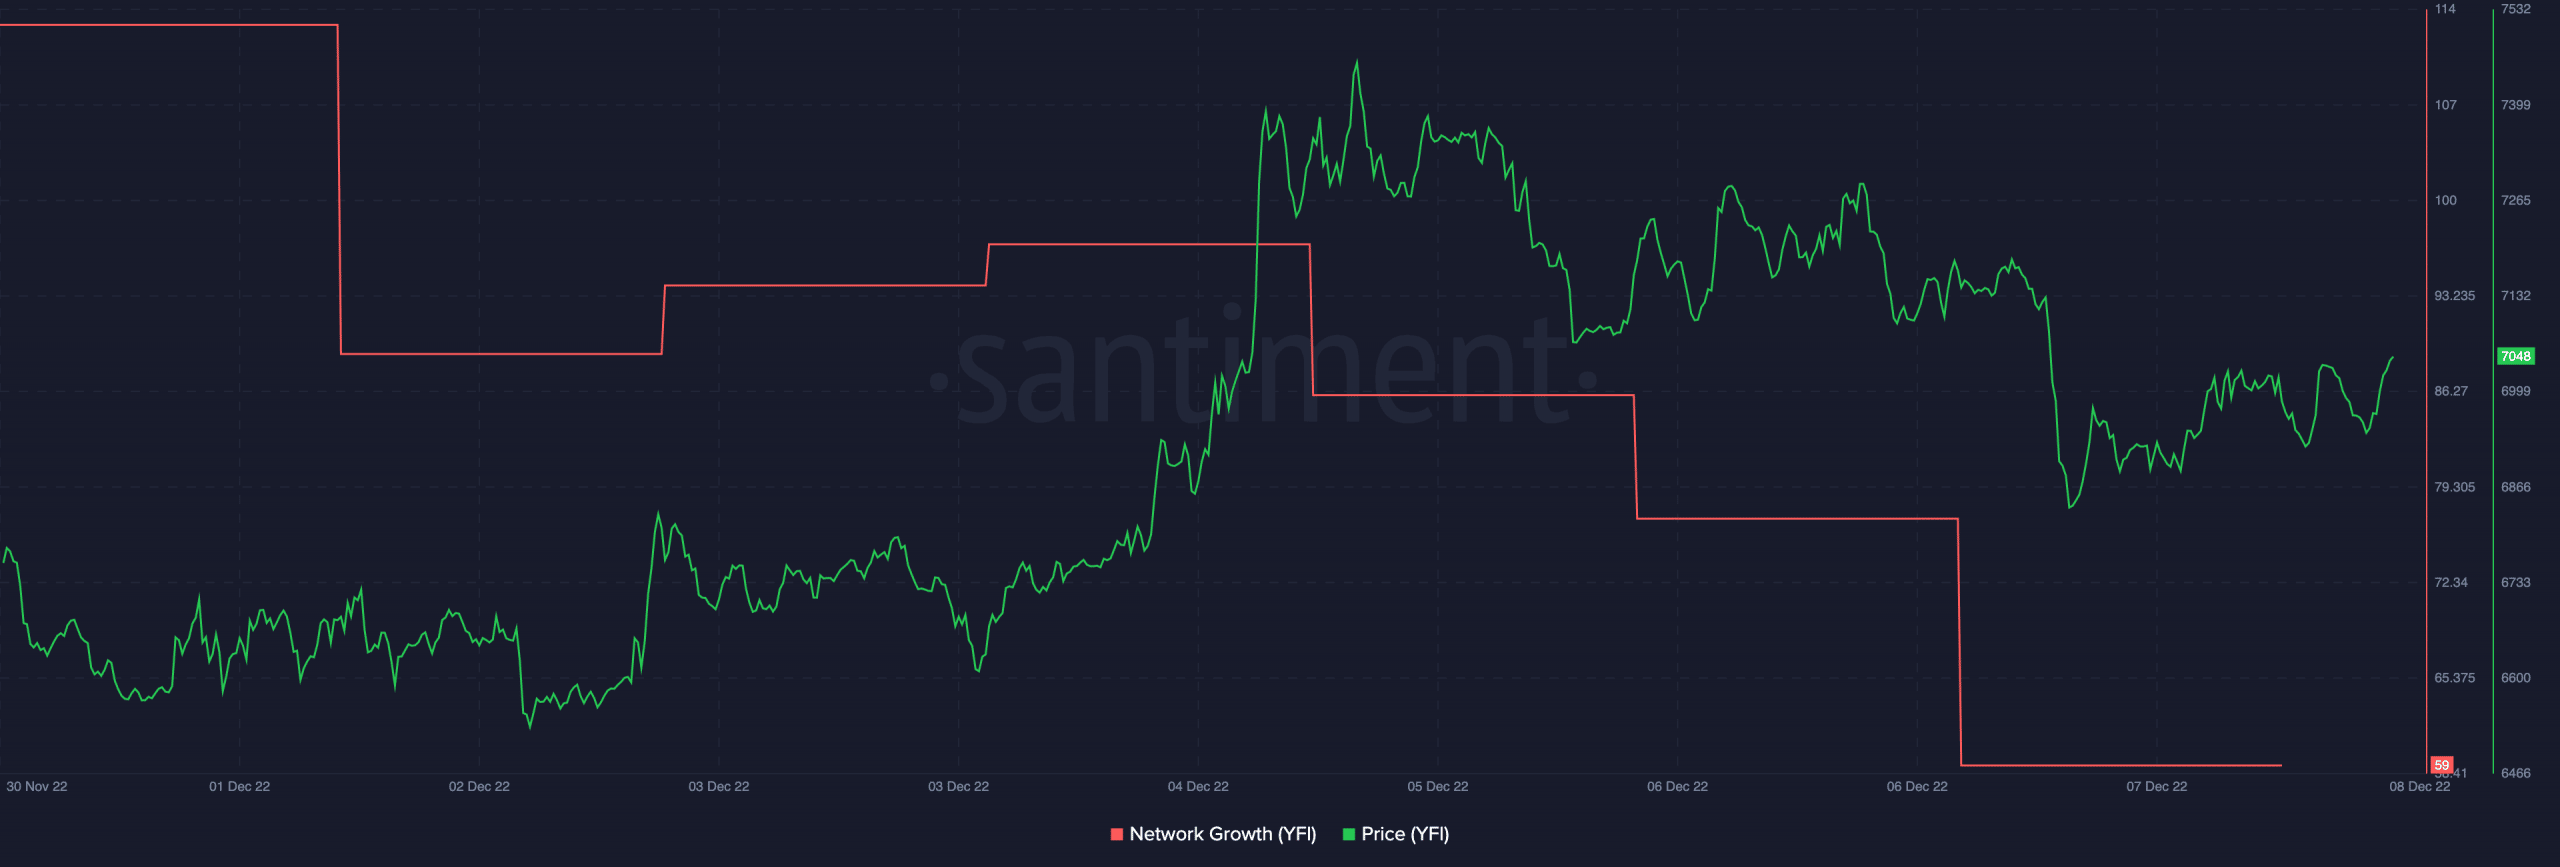
However, data from Santiment showed that new demand for YFI has declined since the beginning of the month. As of this writing, 59 new addresses were on the YFI network. In the last eight days, this has fallen by 48%.
Day traders are not smiling
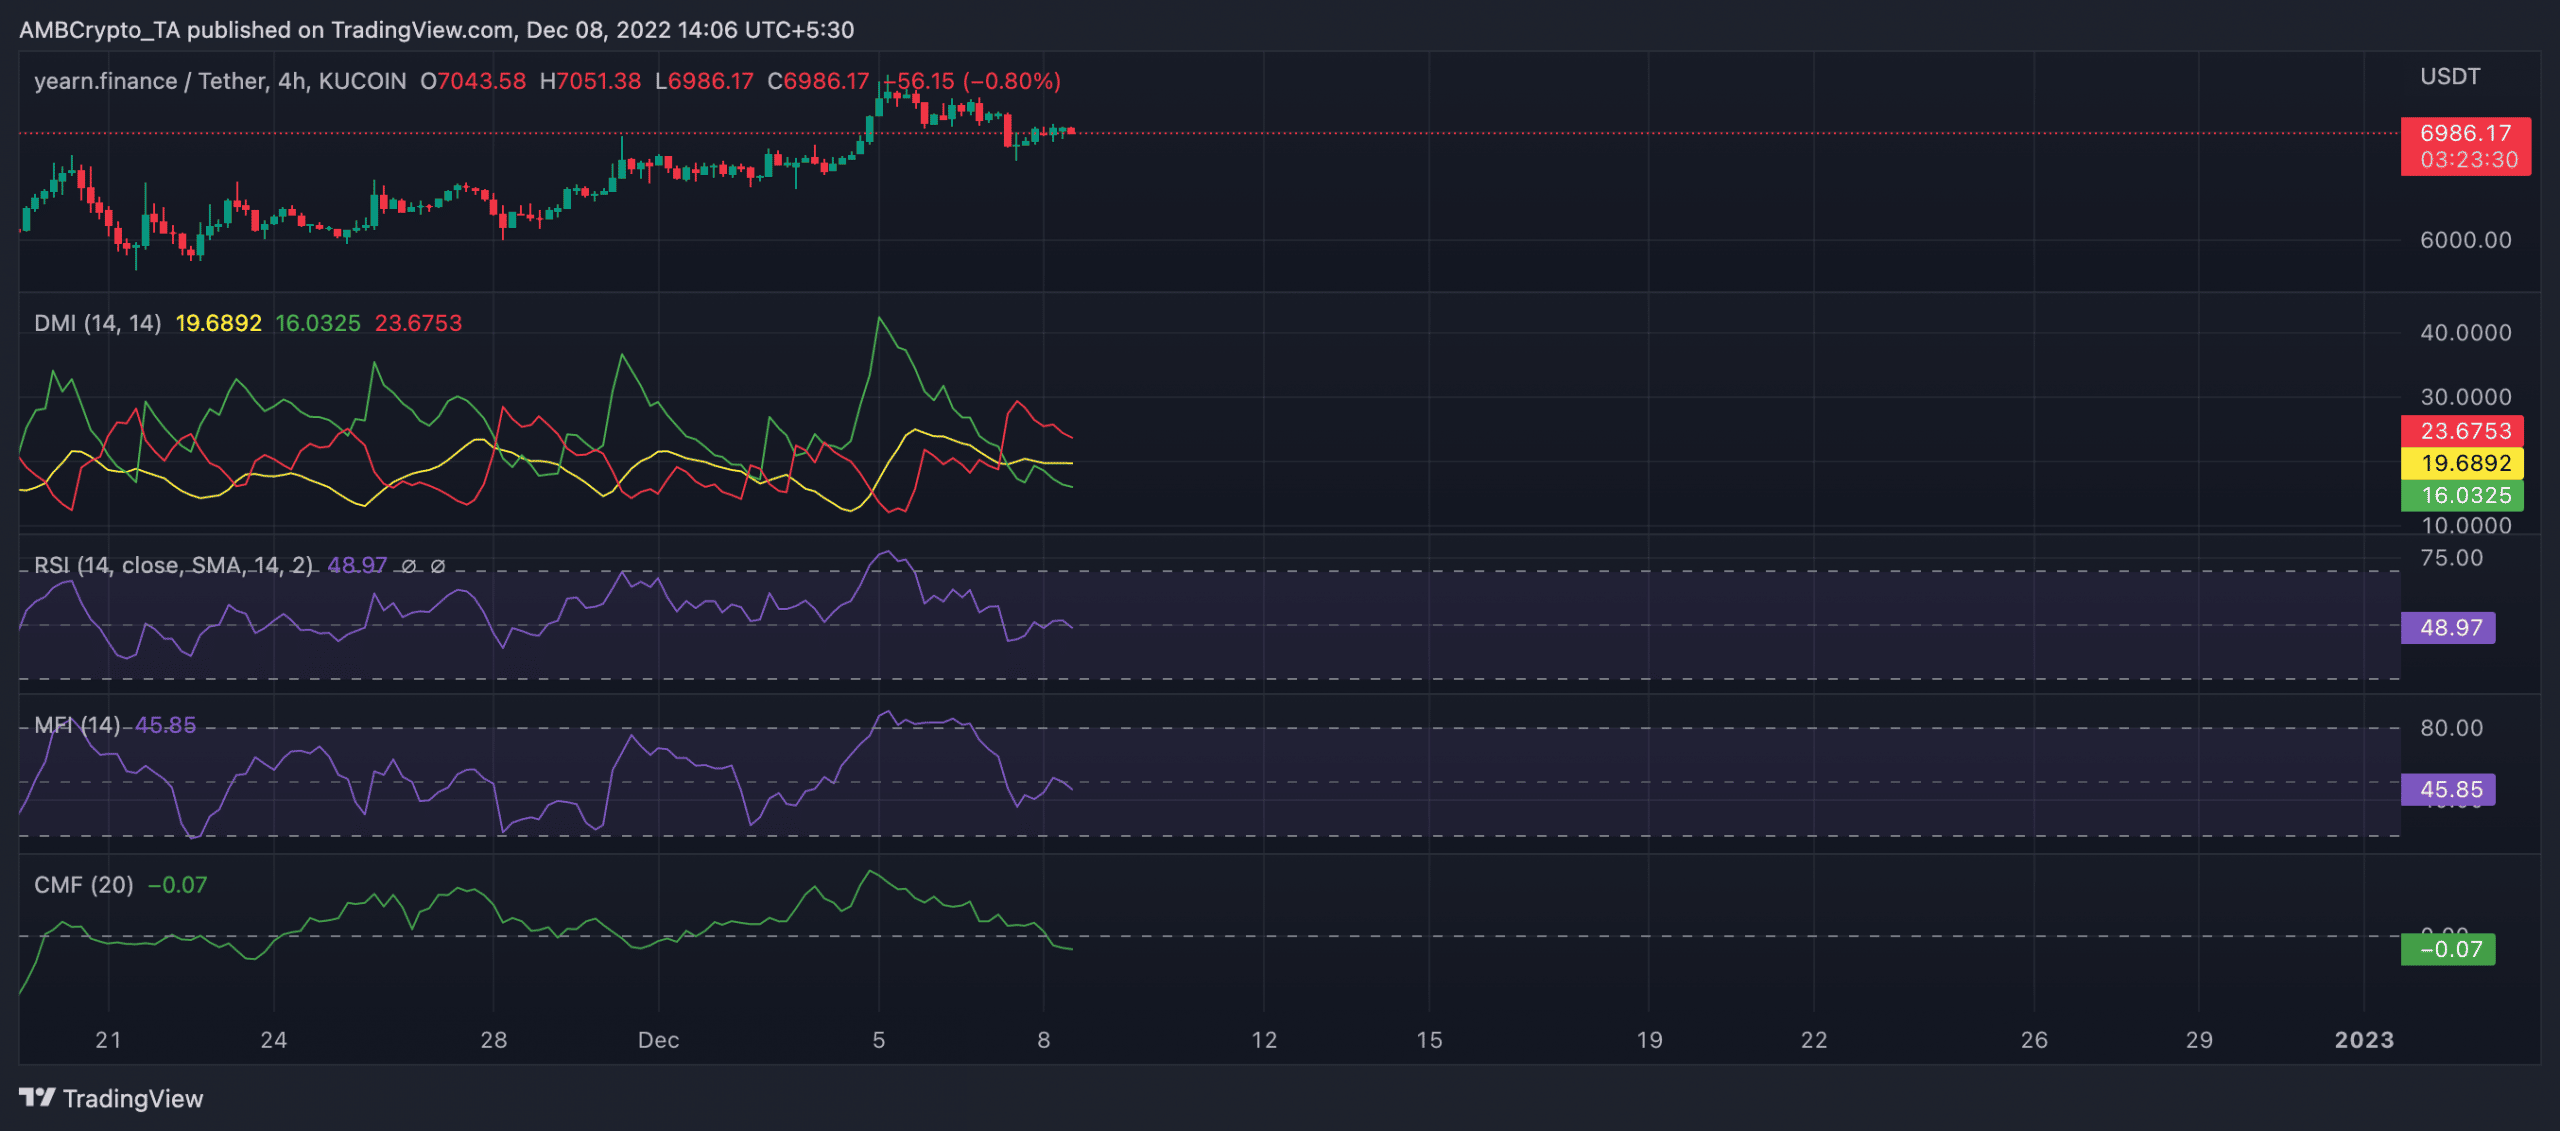
An assessment of YFI’s performance on a 4-hour chart revealed that sellers had control of the intraday market. Selling pressure rallied as daily traders shied away from accumulating the alt.
At press time, the dynamic line (green) of YFI’s Chaikin Money Flow (CMF) rested below the center line to return a negative value of -0.07. A fall of an asset’s CMF below the center line usually indicates that the token’s distribution rate exceeds its accumulation rate within a specified period. A negative CMF is an indication of weakened buying pressure.
Furthermore, the Relative Strength Index (RSI) was spotted at 48.97 in a downtrend. Stationed below the 50-neutral region facing south, selling pressure rallied as more buyers exited the YFI market. Likewise, its Money Flow Index (MFI) was pegged at 45.85 at press time.
The position of the Directional Movement Index (DMI) confirmed the strength of YFI sellers during the intraday trading session.
The sellers’ strength (red) at 23.67 was solidly above the buyers’ (green) at 16.03. Additionally, the Average Directional Index (ADX) showed that the seller’s strength was a difficult one that buyers might find impossible during the day’s trading session.