Assessing where Bitcoin, Ethereum actually stand 100 days after May’s crash

Most of the crypto-space’s top altcoins were relentlessly setting new highs, one after the other, less than four months ago. However, the market became merciless one fine day in mid-May, with most crypto-assets ending up shedding close to half their value.
Well, hundred days have passed since 19 May’s crash and the market, at the moment, may be on the cusp of completing a full circle.

Source: Coinstats
Making sense of the conflicting numbers
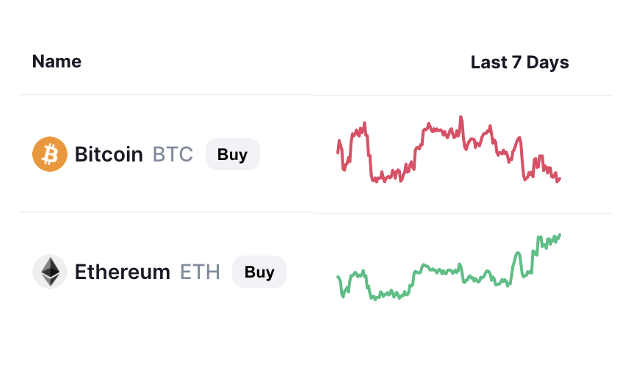
Bitcoin’s price, at press time, was 28% away from its $64k ATH while Ethereum’s price was merely 14% short of its $4350-benchmark. Interestingly, over the past week, Ethereum’s price has seen a 14.25% pump while Bitcoin’s price deflated by 0.5% over the same timeframe.

Source: CoinMarketCap
Over the last couple of years, the market has scrupulously pumped and dumped together. One coin has always managed to take the lead and other coins have historically followed suit. Earlier this year, for instance, BTC was the first one to climb to new highs.
Other altcoins including Ethereum eventually ended up reciprocating congruent trends.
So, who’d lead the rally this time?
At the time of writing, BTC and ETH seemed to be heavily dependant on each other’s price movements. That being said, that market’s largest coins shared a positive correlation of 0.81. Ethereum trading at its 3-month high ($3.5k) at press time, to a fair extent, implied that it had already assumed control of this rally.
Furthermore, the ETH-BTC 1-month realized volatility spread and 1-month implied volatility spread supported the aforementioned narrative. Whenever both these indices have risen in the past, Ethereum has largely been able to outperform BTC in the volatility aspect by making higher highs and lower lows for that matter.
Right now, both the IV and RV have seen notable upticks, thereby giving ETH a positional advantage.

Source: Skew
Bitcoin has evidently not been able to assert its dominance in the space like before. However, Ethereum has been able to make up for the same. In mid-April, for instance, the market cap dominance percentage of Bitcoin and Ethereum revolved around 50% and 15%. However, the same were down to 42% and 19.2%, respectively, at the time of writing.
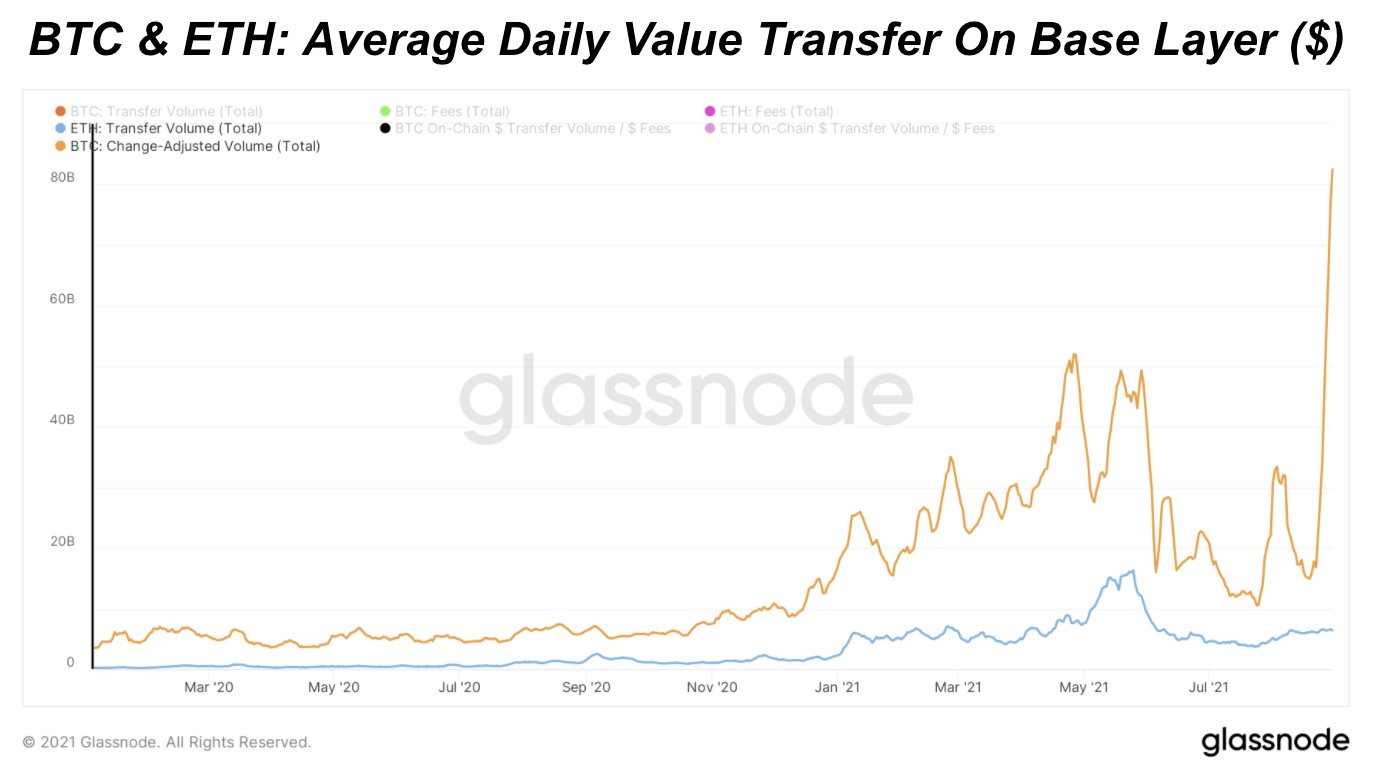
Worth noting, however, that Bitcoin has not been lagging behind on all fronts. Take the daily transfer value, for instance. As can be seen from the chart attached, the transfer value on the base layer of the BTC blockchain amounted to $82.48 billion/day over the past week. Ethereum, on the contrary, saw figures of $6.37 billion/day.
Even though Bitcoin has already been able to surpass its April levels, it should be noted that Ethereum is just at par with its levels seen 4 months back.

Source: Glassnode
The ultimate essence of the 100-day waiting period
Well, the more an arrow is pulled behind before releasing it from the bow’s elastic arc, the farther it goes. Thus, it can be argued that these hundred days were quite critical for the market to step back and prepare itself for the upcoming bullish phase.
It, therefore, can be concluded that almost all cryptos are in a better position than they were in May.


