Assessing whether Bitcoin can slide below $20,000 as FUD intensifies
The latest Glassnode alert revealed that the amount of Bitcoin supply last active in the last two-three years just soared to a 2-year high.

- Bitcoin experienced a week of significant sell pressure, after failing to hold on to the $30k range.
- Weekly sell pressure might slow down with the drop in long liquidations.
Bitcoin [BTC] has been bearish after failing to retain bullish strength above $30,000. Some analysts anticipated such an outcome and even predicted a significant pullback. But is a strong pullback below $20,000 probable if those predictions are correct?
Is your portfolio green? Check out the Bitcoin Profit Calculator
Here’s what we know so far based on recent data. The latest Glassnode alert revealed that the amount of Bitcoin supply that was active in the last two to three years just soared to a 2-year high.
This meant many individuals holding BTC had started moving their coins. Such an outcome suggests that many of them might be selling their coins in anticipation of higher sell pressure.
📈 #Bitcoin $BTC Amount of Supply Last Active 2y-3y (1d MA) just reached a 2-year high of 2,654,292.828 BTC
View metric:https://t.co/ov1FrjgNQz pic.twitter.com/fsYCSFvLh8
— glassnode alerts (@glassnodealerts) April 23, 2023
The bearish expectations also reflected the current state of the market. BTC just concluded a bearish week characterized by whale outflows.
Whales were trimming their balances since mid-April according to the addresses with balances equal to and greater than 1000 BTC.
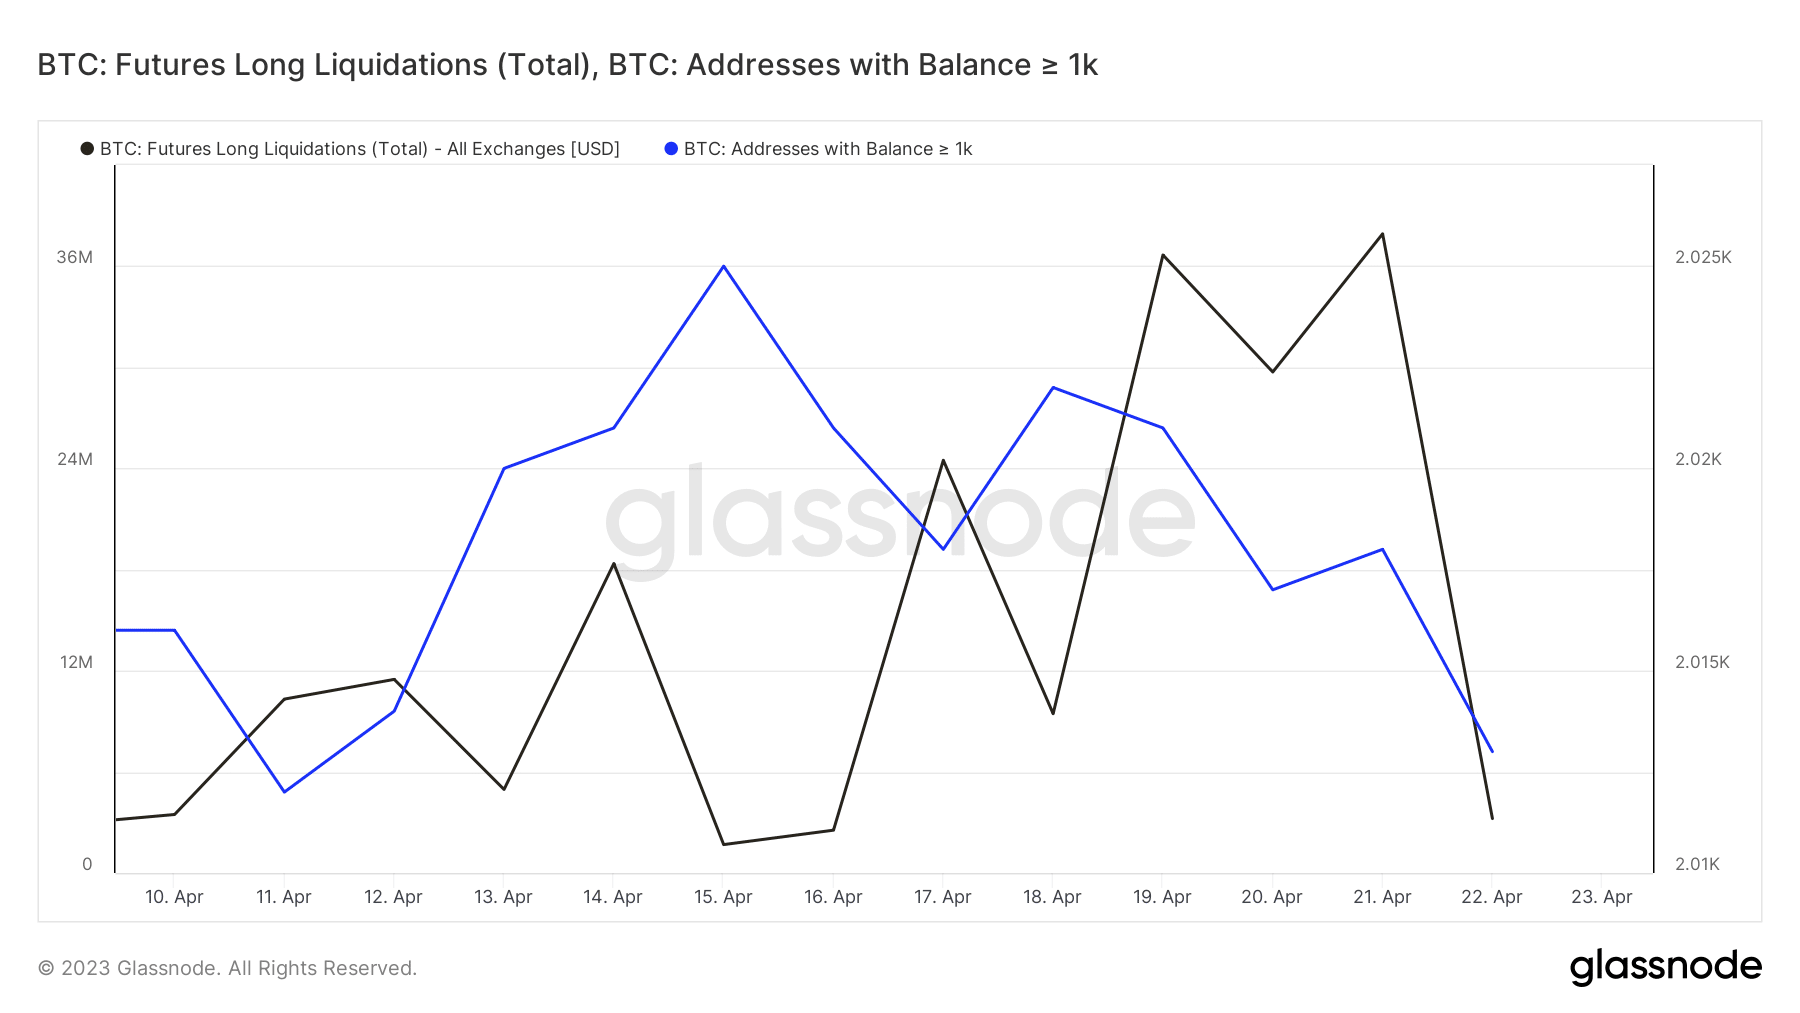
Meanwhile, futures long liquidations increased since mid-April but dropped off from 21 April. Why is this important? Well, the initial surge in liquidations may have fueled more sell pressure as leverage traders were forced to sell.
However, the drop-off in long liquidations indicated that sell pressure might slow down.
BTC exchange inflows have dominated compared to outflows since mid-month. Exchange outflows also increased, likely due to investors buying the dip. The rate of flow for both has been slowing down in the last two days.
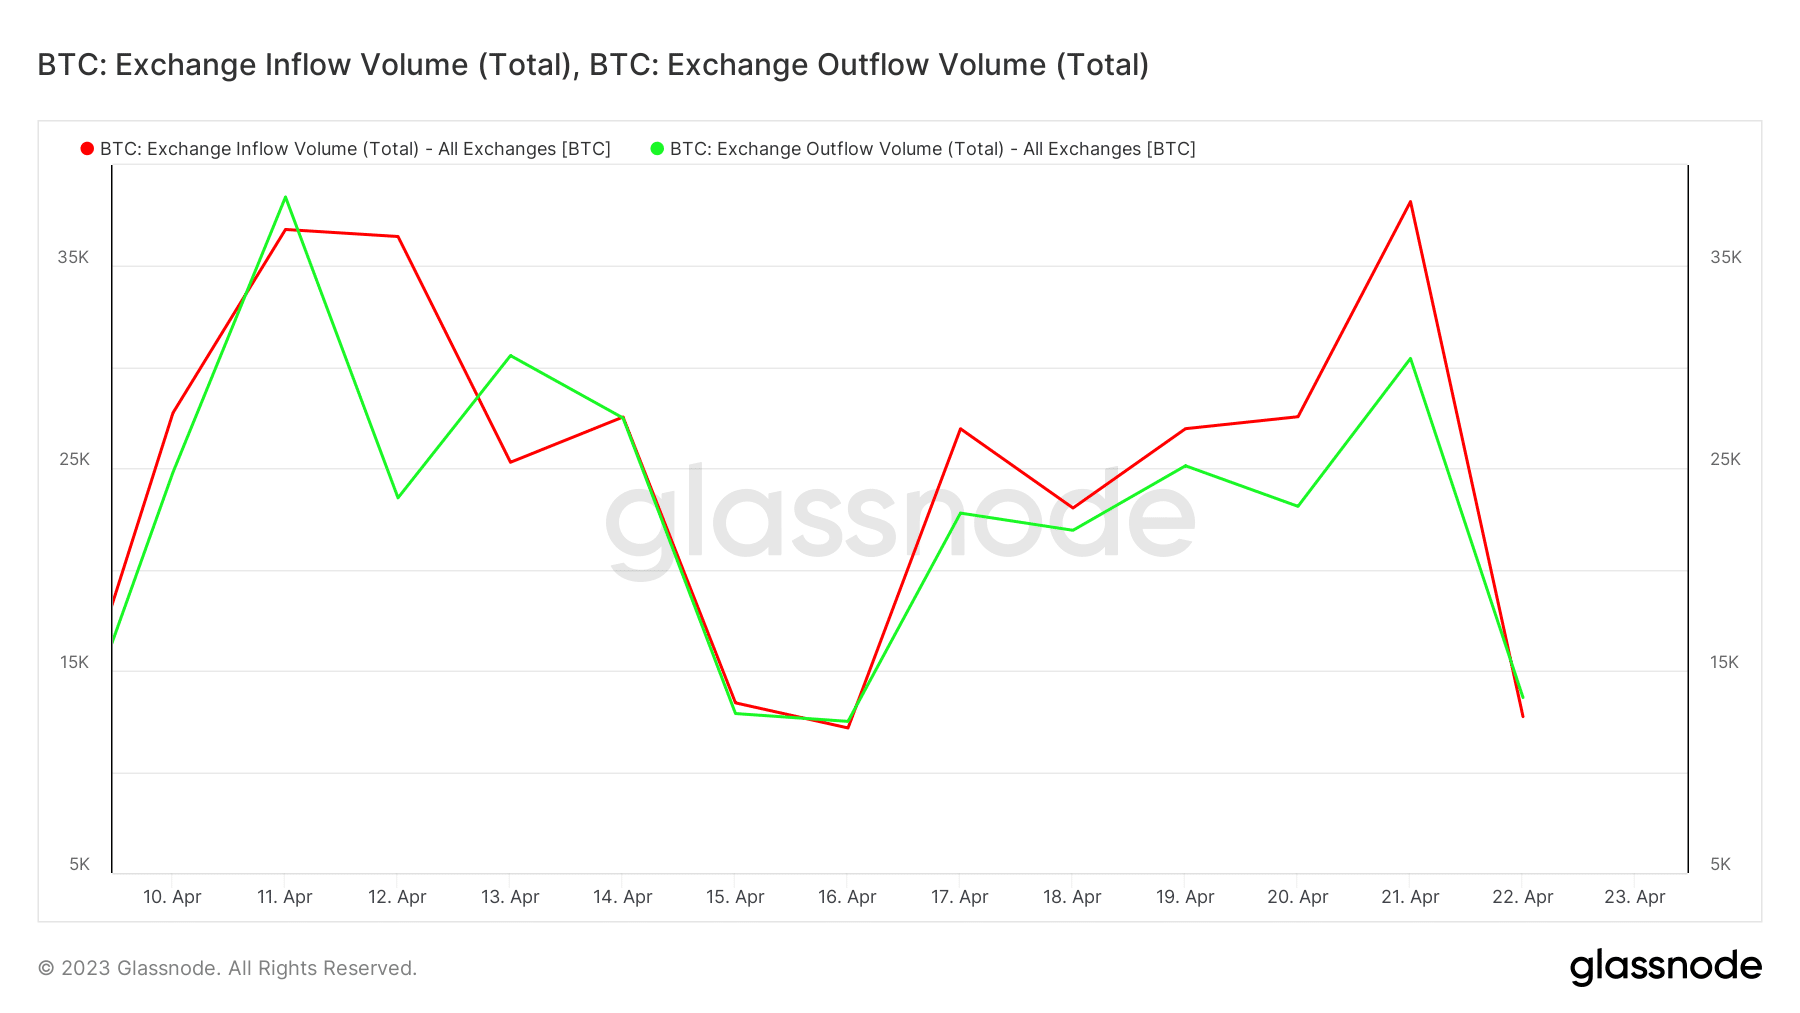
Interestingly, the latest exchange flow data revealed that BTC exchange outflows were slightly higher than inflows. This was a sign that demand was starting to outweigh sell pressure. But does this reflect the price action?
BTC price action
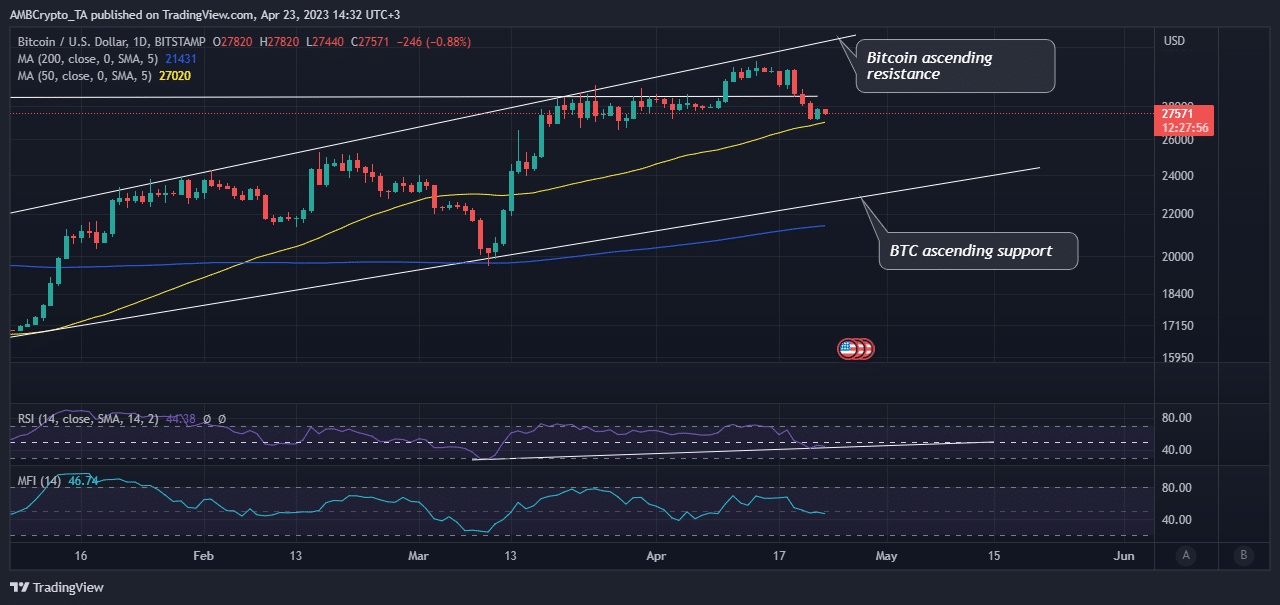
Bitcoin’s $27,557 press time price hovered above its 50-day moving average which may act as a psychological buy zone. But is a strong bounce-back possible at this point? Yes, but so is the possibility of an extended downside.
BTC has been trading within a support and resistance range. Its latest pullback since mid-April came after the price retested the ascending resistance line indicated in the chart below.
How many are 1,10,100 BTCs worth today?
So, what should investors watch out for? A strong resurgence in demand for the 50-day moving average may signal a strong bounce back. Weak demand may pave the way for extended sell pressure.
The second outcome may encourage more selling which will eventually push toward the ascending support range. Such an outcome would lead to the next significant support retest near the $22,900 price range.