Assessing whether TRX can exit its sideways path anytime soon
Tron’s TVL registered a spike over the last few days. While the metric surged, TRX’s price action remained sideways.

- Apart from TVL, Tron’s daily active addresses also increased.
- Though TRX’s weekly chart was green, market indicators turned bearish.
Tron’s [TRX] DeFi space recently witnessed a boost as a key metric shot up, which was encouraging to look at. The blockchain’s network activity also grew over the past few days. However, TRX’s price action remained mostly stagnant in the last seven days.
Read Tron’s [TRX] Price Prediction 2023-24
Tron’s DeFi ecosystem is flourishing
TRONSCAN recently posted a tweet revealing that the blockchain’s TVL witnessed a spike in the recent past. To be precise, TRX’s TVL shot up on 15 September, finally marking an exit from its sideways route. As per the tweet, the top three DeFi projects on TRX were Just Foundation, Staking Governance, and Just Crypto.
At press time, Tron’s TVL stood at $15.45 billion.
🥳The current #TVL on #TRON is $15.4b.
The top 3 projects on #TRON by #TVL are @DeFi_JUST #JustLendDAO ($ 4.73b), $TRX Staking Governance ($ 3.94b), #Just Cryptos ($ 3.06b). pic.twitter.com/ra0wpGW9om
— TRONSCAN (@TRONSCAN_ORG) September 22, 2023
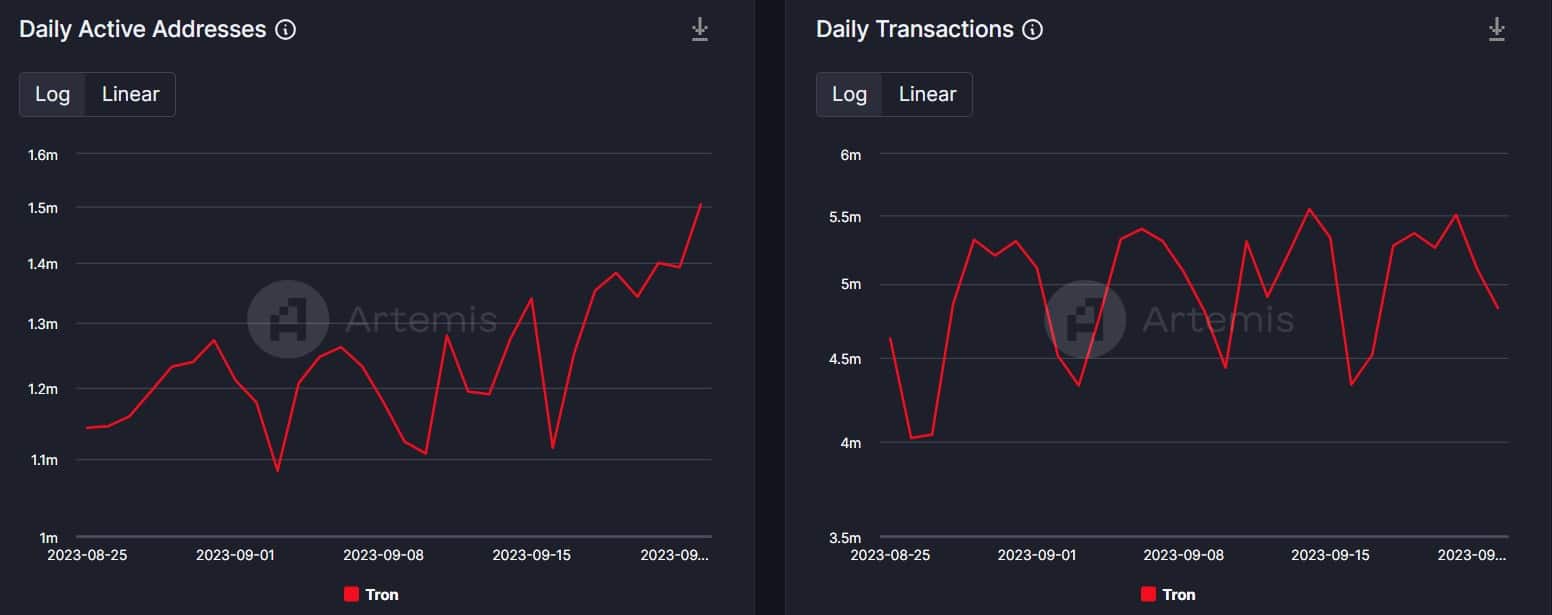
In addition to the TVL its network activity also increased over the last few days. This was revealed by Artemis’ data, as it displayed a sharp spike in its daily active addresses, suggesting more users.
Interestingly, the hike in active addresses did not cause TRX’s daily transactions to spike. As per TRONSCAN’s data, at the time of writing, TRX’s total accounts reached the 185 million mark. At the same time, the blockchain’s total transactions exceeded 6.4 billion.
Will TRX’s price correspond?
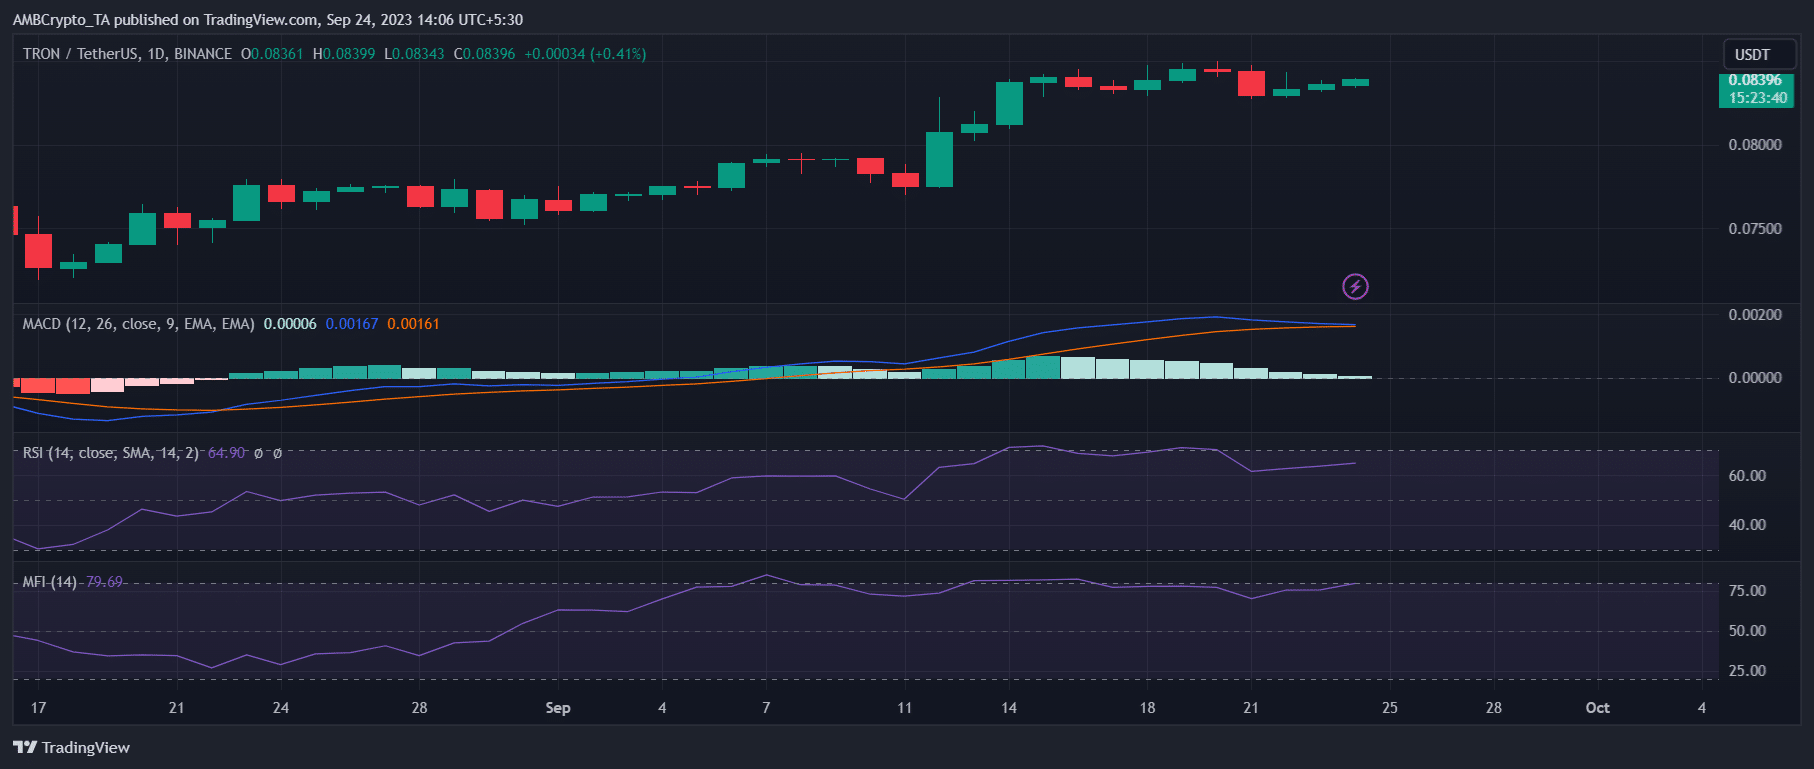
While the ecosystem grew, the blockchain’s native token’s price action took a sideways path. As per CoinMarketCap, TRX’s price only increased by 0.5% over the last seven days.
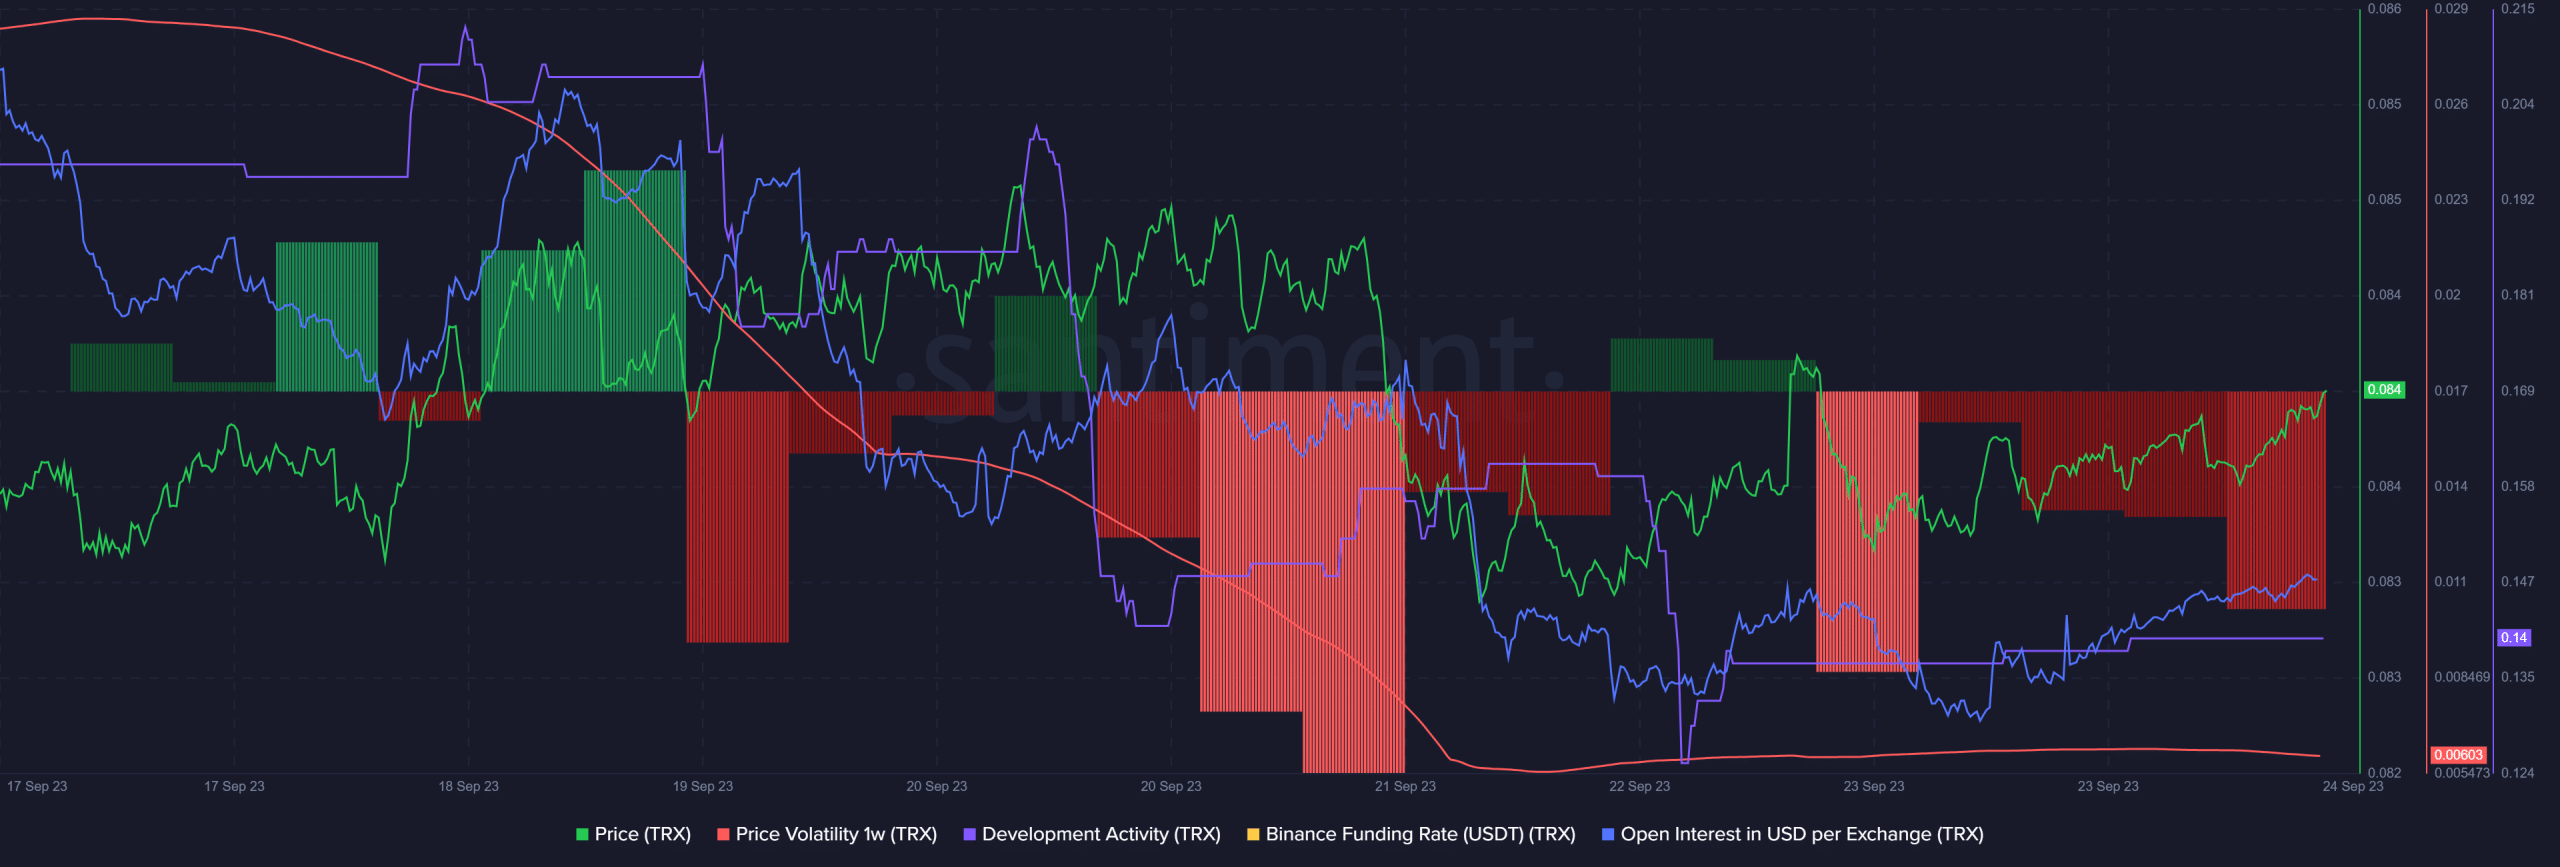
At press time, it was trading at $0.08391 with a market capitalization of over $7.4 billion, making it the 11th largest crypto. Development activity around the blockchain also dropped last week.
However, other metrics suggest that things can change soon. For instance, TRX’s funding rate was red.
Usually, prices tend to go opposite to that of the funding rate. Hence, there could be a price uptick. The token’s 1-week price volatility also sank last week. Moreover, TRX’s open interest dropped last week.
Is your portfolio green? Check the TRX Profit Calculator
Though a few metrics were positive, a look at TRX’s daily chart told a different story. Both TRX’s Relative Strength Index (RSI) and Money Flow Index (MFI) were near the overbought zone, which can increase selling pressure on the token.
On top of that, TRX’s MACD displayed the possibility of a bearish crossover, suggesting that the token’s price can witness a correction in the days to follow.