Aster eyes move toward $0.467 – But 25% drop is avoidable IF…
One level continued separating a potential recovery from another leg lower.

The bearish outlook for Aster [ASTER] appeared to strengthen despite its recent recovery. Ongoing geopolitical tensions, a bearish chart structure, and declining whale holdings weighed on sentiment.
As of 8th June 2026, ASTER was down 1.75% over the past 24 hours, trading at $0.632 below the key $0.65 breakdown level. That weakness was accompanied by fading participation. Trading volume dropped more than 22% to $99.97 million.
Why is ASTER struggling to recover?
The daily chart showed that ASTER recently broke down from a parallel channel and closed below the key $0.65 support level.
The breakdown opened the door for further downside. Even though the token recovered more than 8% over the past two days, it failed to reclaim $0.65. That failure kept the bearish structure intact.
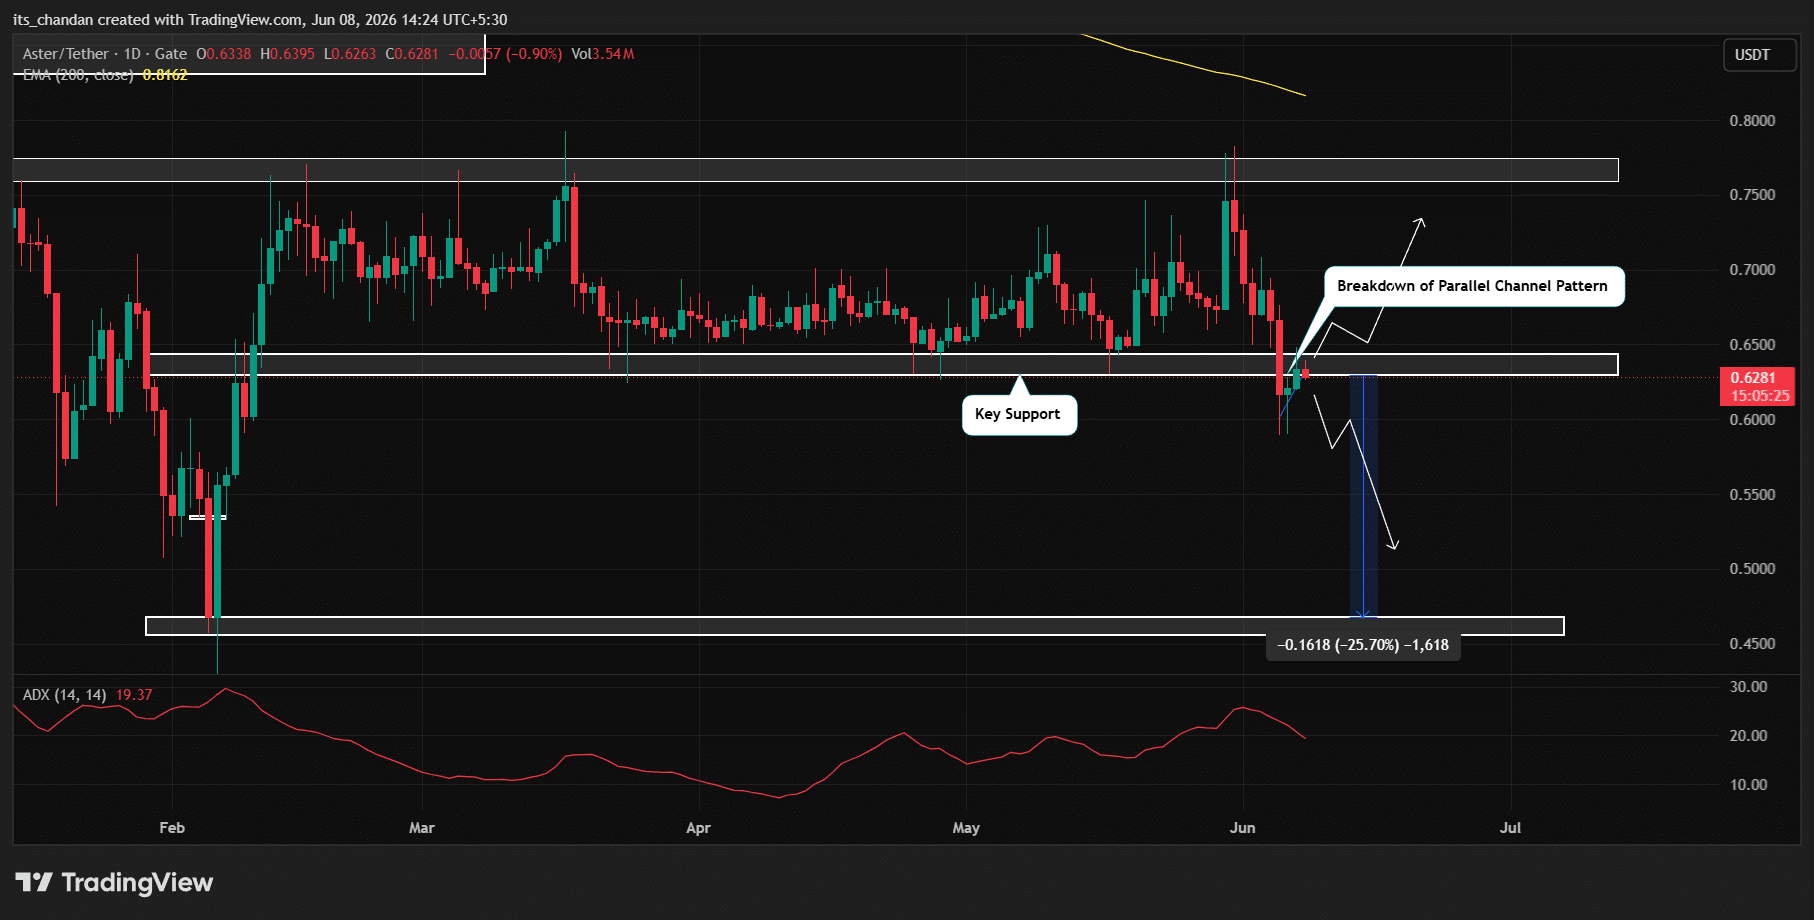
Based on current price action, ASTER could decline toward its next support at $0.467 if it remains below $0.65. That would represent a further drop of roughly 25%.
However, a move back above $0.65 would invalidate the bearish setup.
On top of that, ASTER traded below its 200-day Exponential Moving Average (EMA), suggesting the broader trend remained weak.
Meanwhile, the Average Directional Index (ADX) stood at 19.37, below the 25 threshold. That reading indicated limited trend strength despite recent volatility.
What are major holders doing?
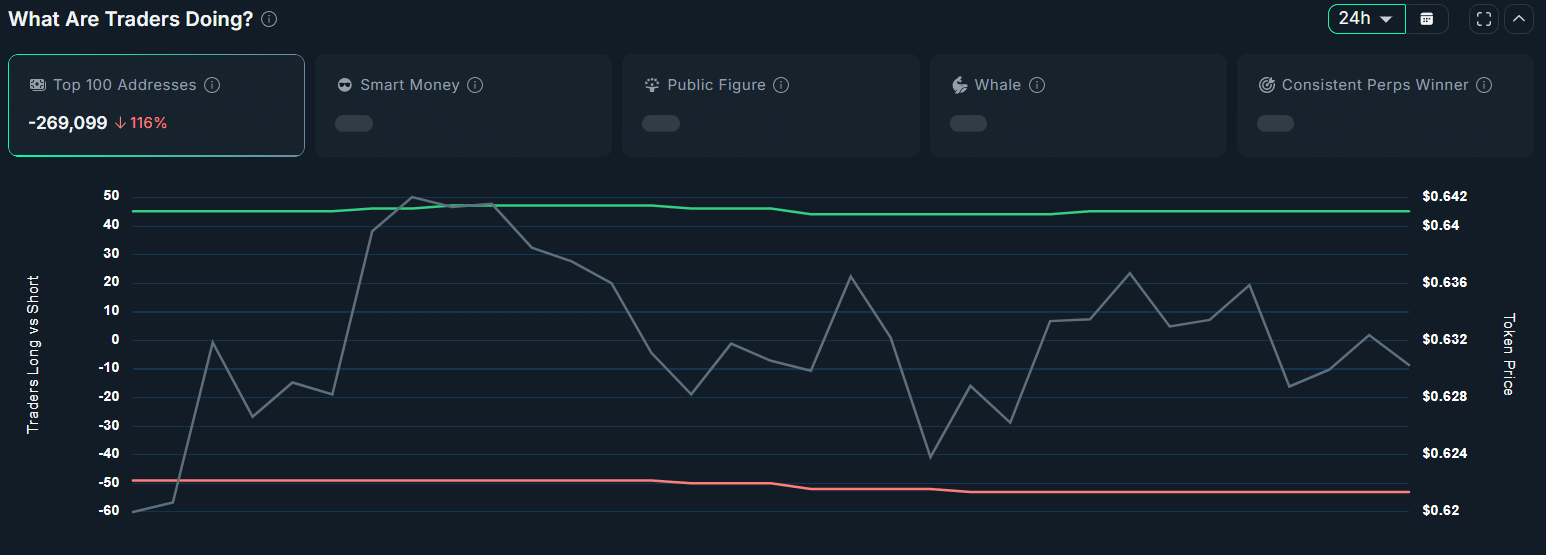
On-chain data suggested that large holders were reducing exposure.
According to Nansen, the Top 100 Addresses recorded a negative balance change, with holdings falling by 269,099 ASTER.
That decline indicated that some of the network’s largest holders were trimming positions during the ongoing downtrend.
That shift set up a closer look at trader positioning.
Derivative traders appeared to share a similar view.
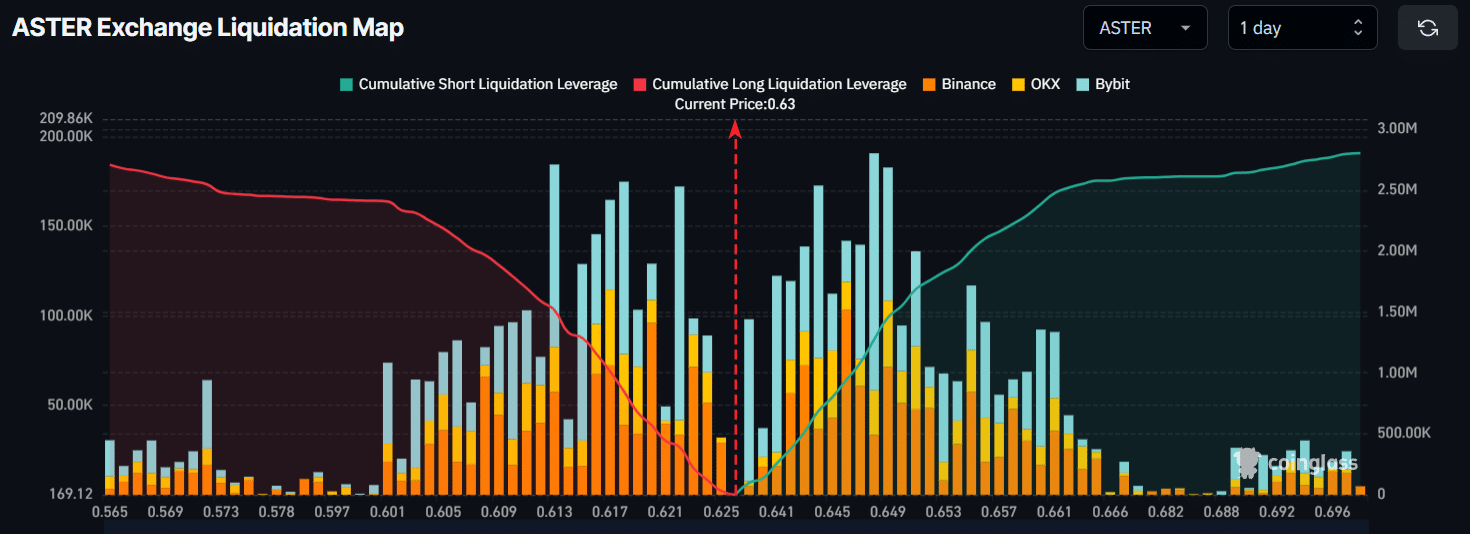
According to CoinGlass, ASTER’s Long/Short Ratio fell to 0.9646, indicating that short positions slightly outweighed long positions.
Meanwhile, $0.613 and $0.648 emerged as the largest liquidation clusters. Data showed traders built $1.01 million in long positions near $0.613 and $1.27 million in short positions near $0.648.
Taken together, the on-chain and derivatives data suggested that both large holders and short-term traders remained cautious. This left traders focused on whether ASTER can reclaim $0.65 or extend its decline toward lower support levels.
Final Summary
- ASTER remained below the key $0.65 breakdown level despite an 8% recovery attempt.
- Nansen data showed the Top 100 Addresses reduced holdings by 269,099 ASTER.


