ATOM breaks down from a range, retests it as supply in a short-term bearish trend

For the better part of January, the price of Cosmos held well within a range formation between the $34 and $44 levels. However, the sell-off last week saw the price plummet beneath the range lows and retest it as an area of supply. News of bridge implementation between Cosmos and other chains came out a couple of weeks ago, but a wider market slump saw ATOM decline too. The slow rise in Bitcoin Dominance does not bode well for altcoins either. The BTC Dominance chart has been in a strong uptrend even on lower timeframes recently and showed that altcoins could suffer losses in the coming days.
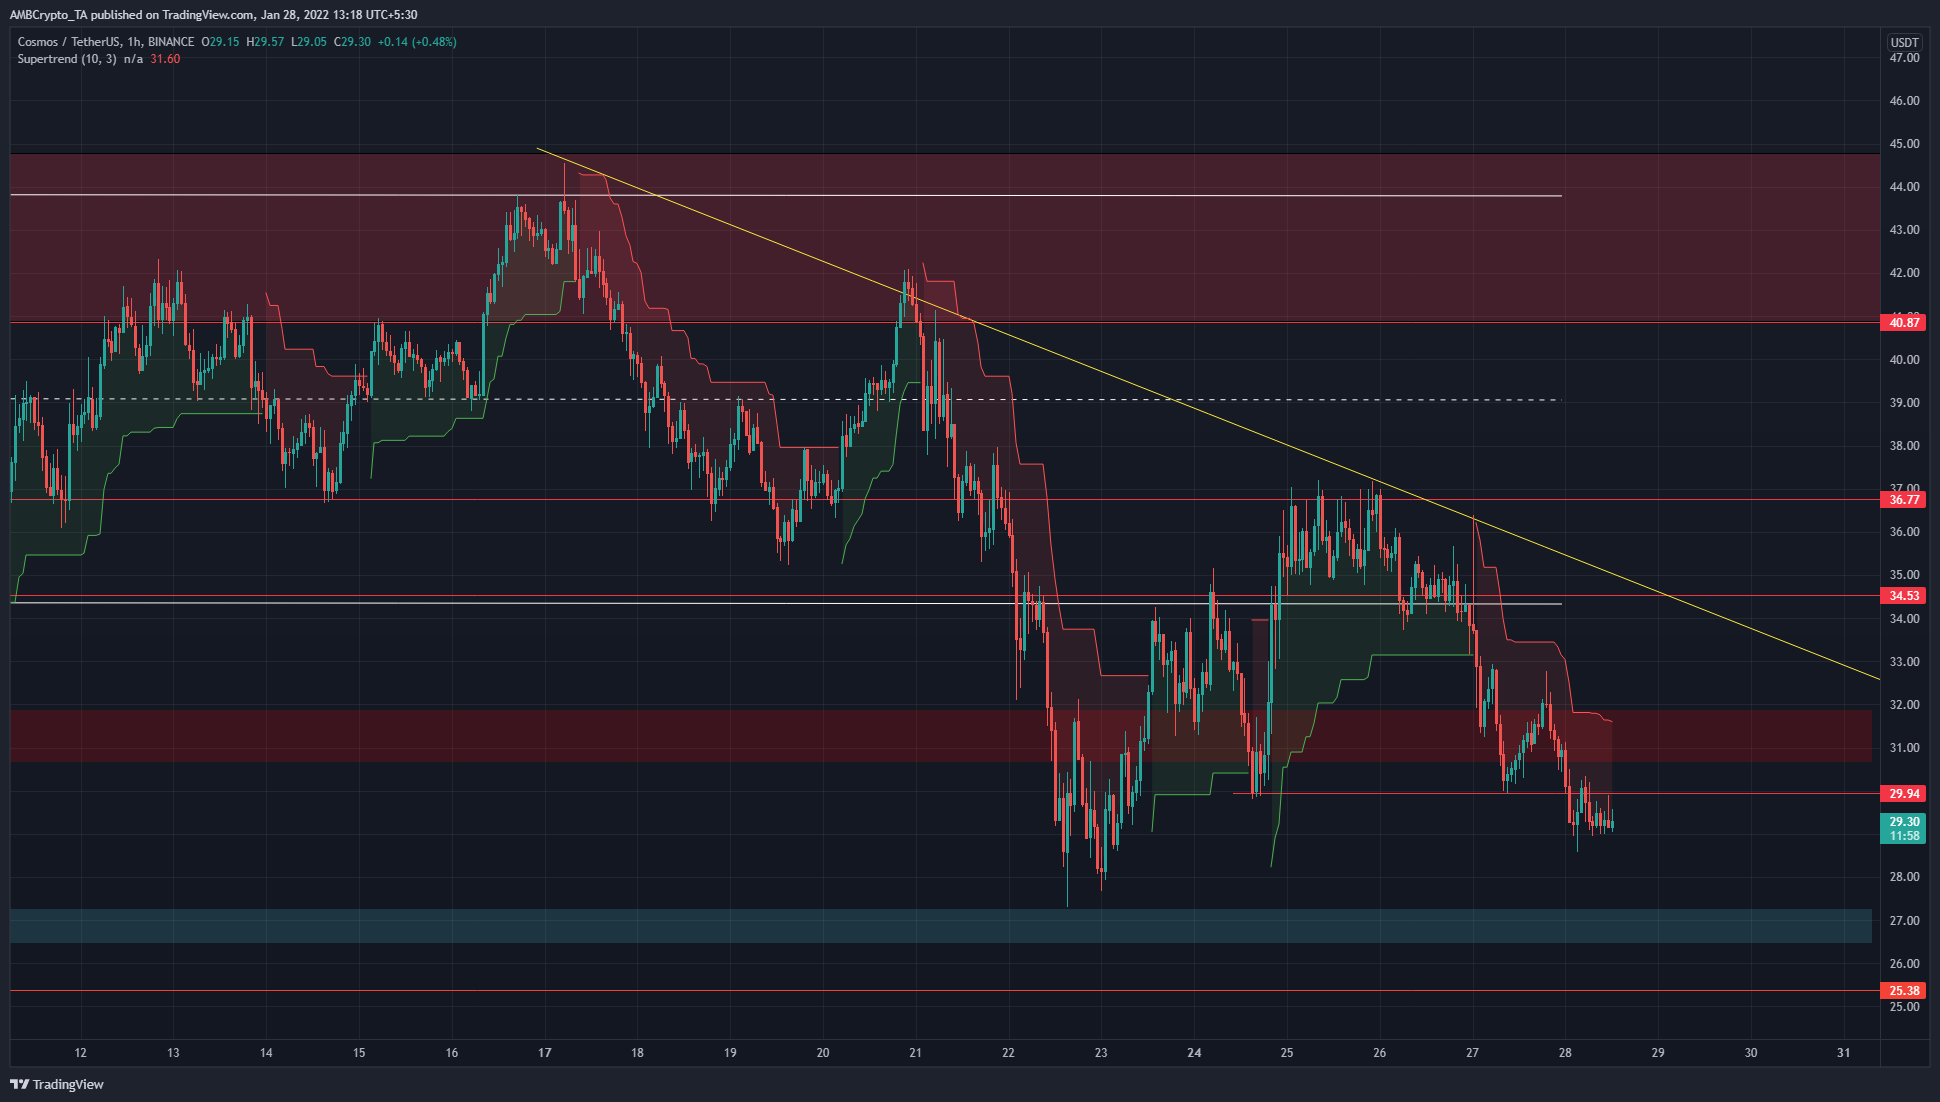
The $44 area (upper red box) represented the range highs ($34-$44 range) as well as the ATH territory for ATOM, a strong supply area. Earlier this month, it was a sign of bullish strength that ATOM was able to hold on to this range even when Bitcoin hovered above $40.5k.
However, once BTC dropped hard below this level, so too did ATOM. Since then a downtrend (yellow) has been established in the lower timeframes, with the trendline resistance yet unbroken.
The $34.5 and $36.7 are a pocket of liquidity at the range lows, and the recent ATOM bounce saw this liquidity tested and the price was unable to climb higher.
At the time of writing, the $30 level and the $31-$32 pocket (red box) represent places on the chart where sellers might step in once again.
Rationale

The RSI has remained resolutely beneath neutral 50 in the past couple of days. The Stochastic RSI was climbing back toward the overbought territory, even as the price traded sideways and the RSI also did not establish a higher high. This was a sign that another leg down could be imminent.
The OBV has been in a downtrend alongside price, an indication of the strong selling pressure in the past week. The Supertrend indicator also showed a sell signal.
Conclusion
A move past $34 and a break of the trendline resistance would be needed to break the downtrend. However, this was unlikely. ATOM might push as high as $32 before declining toward the $27 area (cyan box) where buyers might place strong bids. Hence, the $31 and the $27 regions will hold some importance in the next few days.


