ATOM is stuck below its ATH, but this level might come into play

Disclaimer: The findings of the following analysis are the sole opinions of the writer and should not be considered investment advice
In early January, Cosmos was on a strong uptrend and approached the $44 supply area with strong momentum. Alas, since then, the price has been rejected and found demand at the $34-level.
A range has been established between these two levels for ATOM. One of the reasons behind Cosmos’ strong performance over the past month, despite weakness in the rest of the market, could be the recognition and growth of its blockchain ecosystem.
ATOM- 1-hour chart
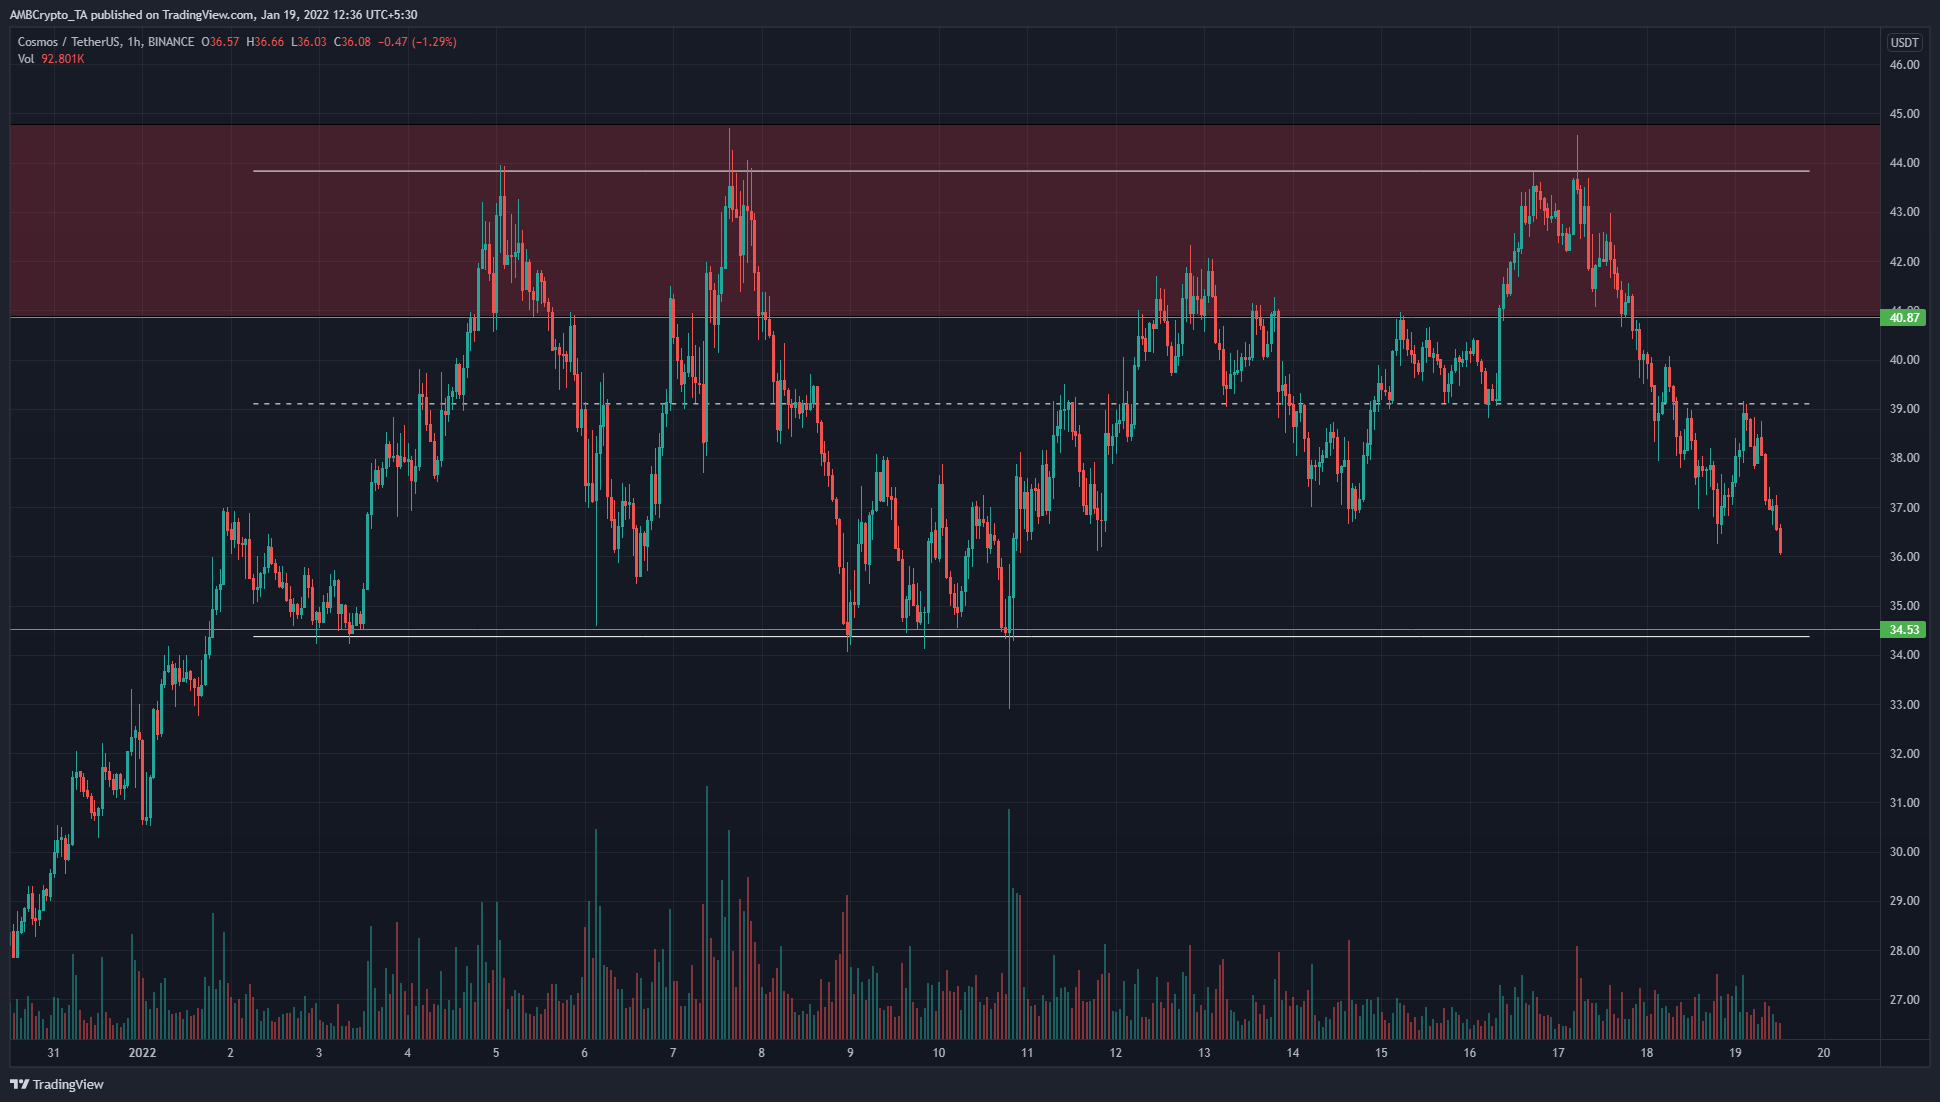
The range (white) had its highs at $43.8 and lows at $34.36. There was confluence with a significant level of support at $34.5 as well. Within the range, the $40.8-level and the mid-point of the range at $39.1 have also acted as support and resistance levels. At the time of writing, the price faced resistance at $39.1 and looked to be heading towards $34.5.
The formation of a range was indicative of a consolidation. However, whether this was an accumulation or distribution phase is yet unclear. Only a breakout from the range either to the upside or lower would confirm this.
Such a consolidation beneath the ATH could see Cosmos break the market structure and rocket upwards. However, this scenario would need Bitcoin to hold steady above the $40k support. The sentiment in the crypto-market is not as euphoric as it was three months ago. If Bitcoin faces another wave of strong selling, it could drag Cosmos lower as well.
Rationale
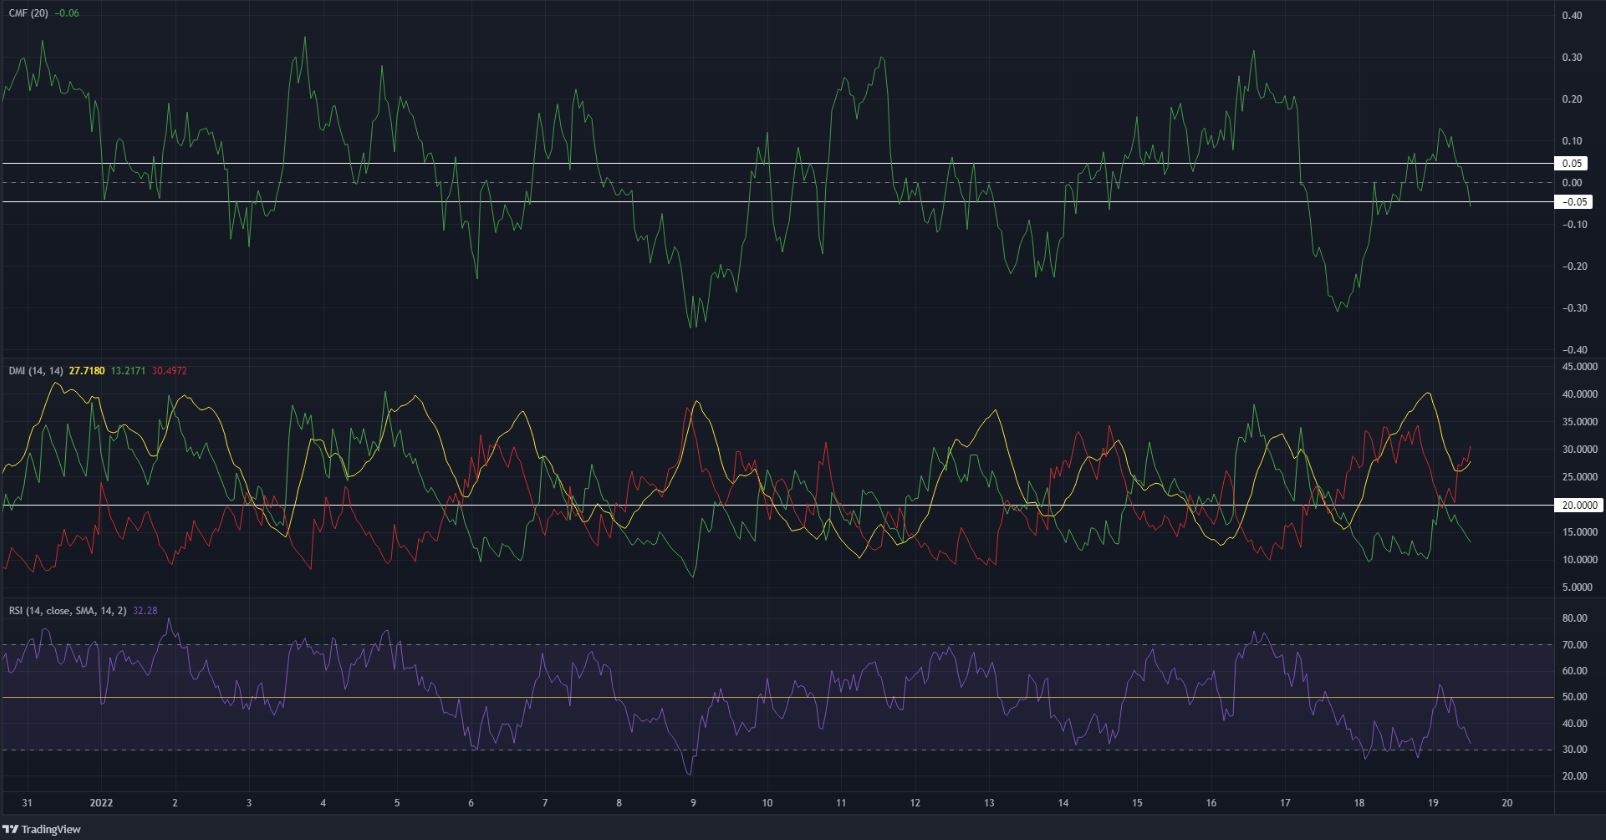
The Chaikin Money Flow was at -0.05 and could close a session below this value. This would indicate that capital flow has been heading out of the market. Alongside the same, the RSI faced rejection near the neutral 50 value and was nearing 30 at press time, another indication of strong bearish pressure.
The Directional Movement Index also noted a strong bearish trend in progress for the past couple of days as the price faced a sharp rejection at the range highs. The -DI (red) and the ADX (yellow) have both been well above the 20-mark.
Conclusion
The indicators showed strong bearish momentum for ATOM in the short term. Combined with the range that was identified, the $34.5 area is a good area to buy ATOM at from a risk-to-reward perspective.
If the price closes a session below $34.5 and retests it as resistance, these buys can be sold. Such a move would indicate that the $34.5-level was flipped from support to resistance.


![Stacks [STX] crashes to $0.13 even as PoX-5 testnet goes live – Why?](https://ambcrypto.com/wp-content/uploads/2026/07/IMG-20260725-WA0006.jpg)