ATOM price rebounds, is a $13 prediction on the cards?
ATOM's one-day price chart shows that the market structure is bullish.

- ATOM maintained its bullish bias despite short-term price volatility.
- A move to $12.6 in the coming hours was likely, but it was unclear if the bulls could breach the HTF resistance.
Cosmos [ATOM] retraced by just over 17% from the 12th to the 18th of December. After revisiting the support level at $10.3, ATOM prices were quick to rebound. This hinted at a buyer-controlled market.
A recent AMBCrypto report highlighted that Cosmos’ network activity has dropped, even though prices have climbed higher. This could be a cause for concern among holders.
The $12.5 territory was still in bearish hands
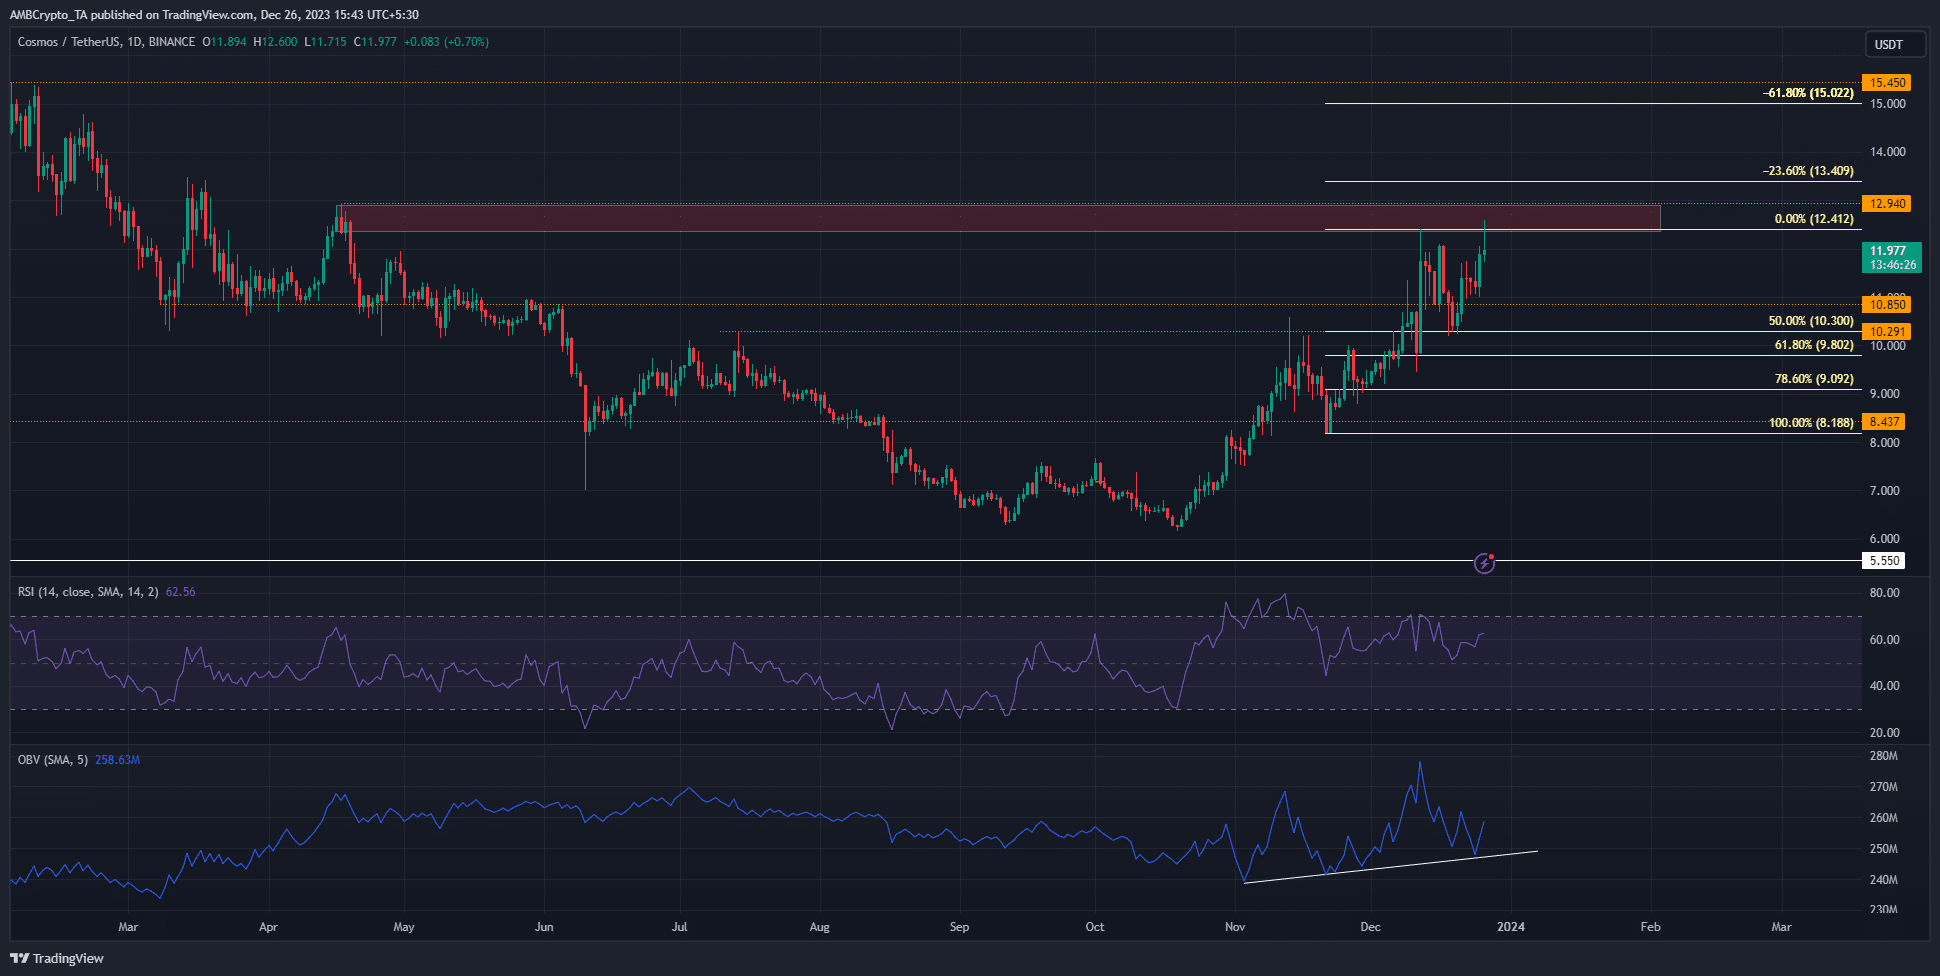
The one-day chart of ATOM showed that the market structure was bullish. After a test of the $12.41 resistance, the 50% retracement level at $10.3 was revisited. Thereafter, ATOM prices continued higher.
The bearish order block at $12.4-$12.95 has presented a large obstacle to ATOM bulls in December. The bullish structure meant a move higher was likely. The RSI was at 62, showing strong upward momentum on the D1 timeframe.
The OBV was also trending higher since November. However, it has seen a lot of volatility as selling volume suddenly ramped up.
Despite this, the formation of higher lows showed buyers have the upper hand.
A short-term move to $12.6 was likely
The 12 hours before press time saw Bitcoin [BTC] prices bleed from $43.7k to $42.1k. Having collected the liquidity just above $42k, BTC prices appeared ready to ascend once more. This drop affected ATOM prices too.
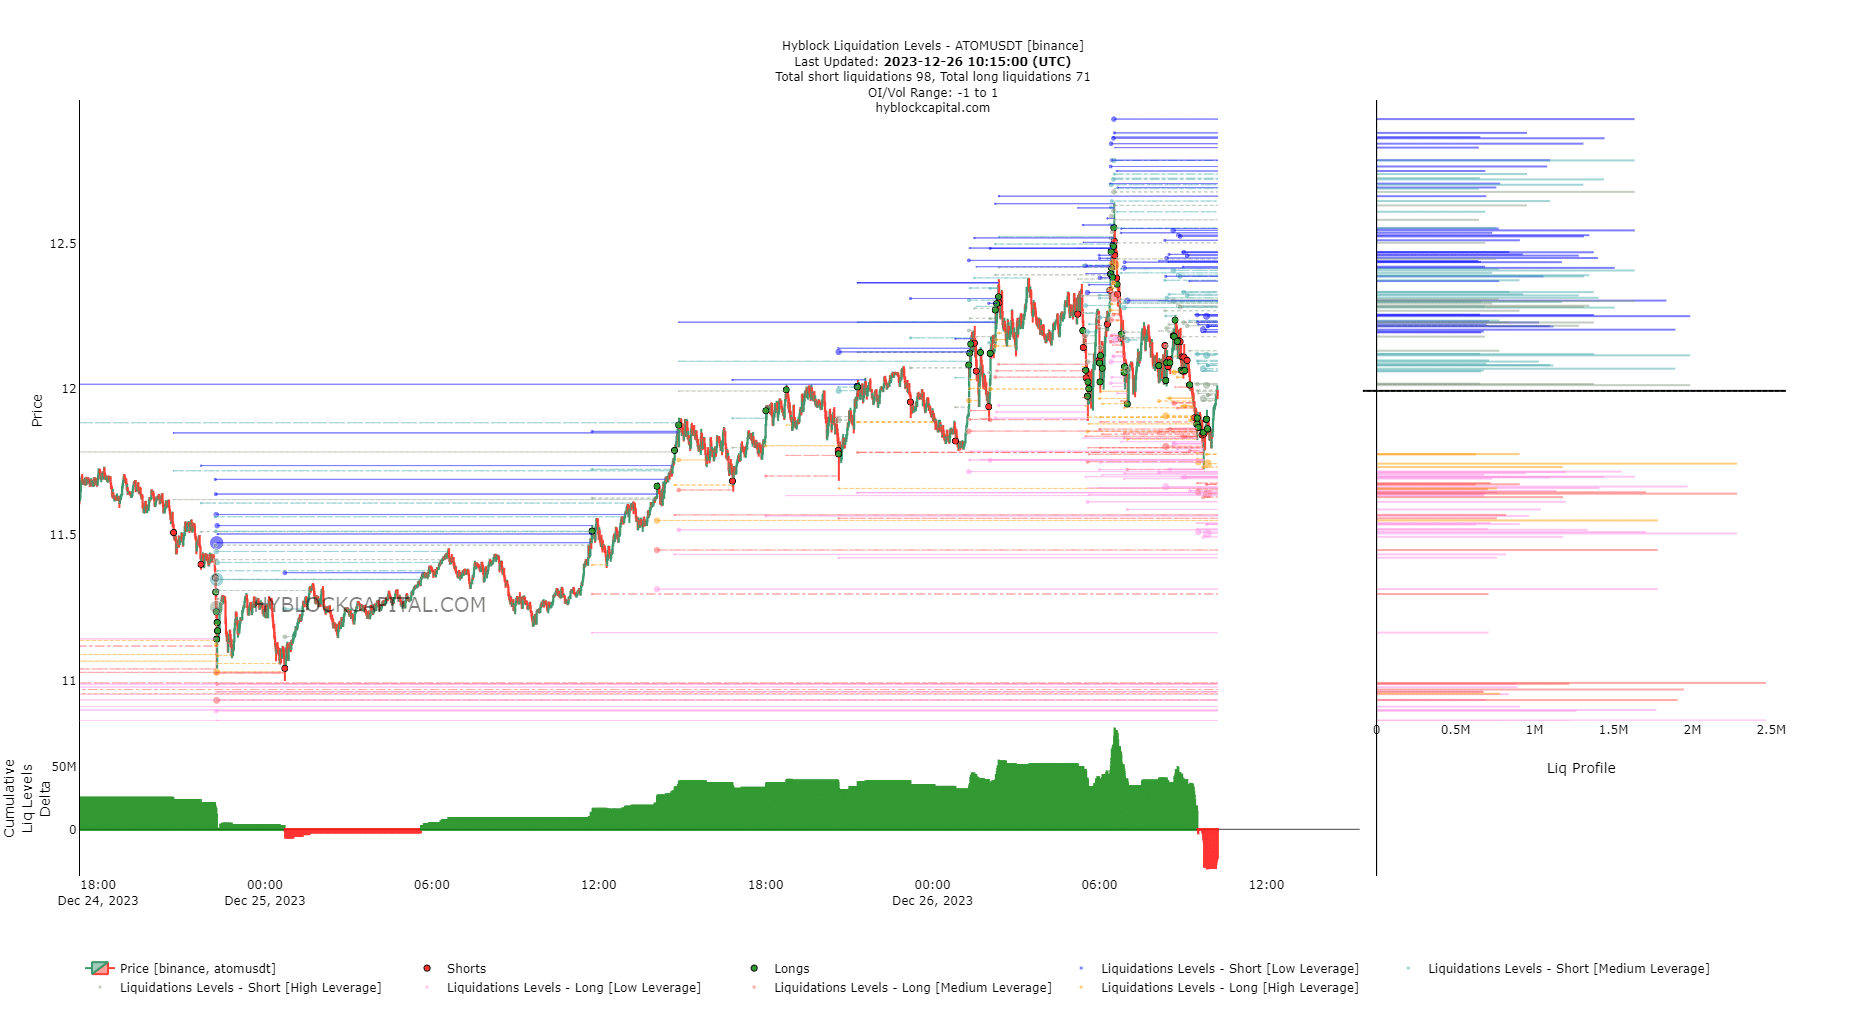
ATOM fell to $11.75 and its Cumulative Liq Levels Delta dived into negative territory. AMBCrypto noted that this suggested that more participants were willing to go short. However, this development could see ATOM bounce higher to liquidate these late bears.
Is your portfolio green? Check out the ATOM Profit Calculator
The $12.3-$12.65 zone has multiple estimated liquidation levels of $1.5M or more. To the south, the $11.62-$11.7 region was a strong support zone. In the short term, it is expected that ATOM will climb to $12.6.
For swing traders, a move past $12.9 and a retest of the bearish OB would present a good buying opportunity, targeting $13.4 and $15.
Disclaimer: The information presented does not constitute financial, investment, trading, or other types of advice and is solely the writer’s opinion.