ATOM stalls after a 45% rally in two weeks — is the uptrend at an end

Disclaimer: The findings of the following analysis are the sole opinions of the writer and should not be considered investment advice
- Cosmos has performed positively in the past two weeks
- Can bulls look to re-enter longs on a lower timeframe pullback?
Bitcoin [BTC] ran into resistance near the $21.5k mark. The selling pressure of the past few hours was felt across the market and ATOM was no exception. In the 36 hours preceding the time of writing, ATOM posted losses close to 10%.
Here’s AMBCrypto’s Price Prediction for Cosmos [ATOM] in 2022-2023
USDT (Tether) Dominance was on the rise over the past two days in response to the drop in prices over the weekend. However, on the charts, ATOM retained its bullish outlook.
$14 is a strong place for the prior rally to resume
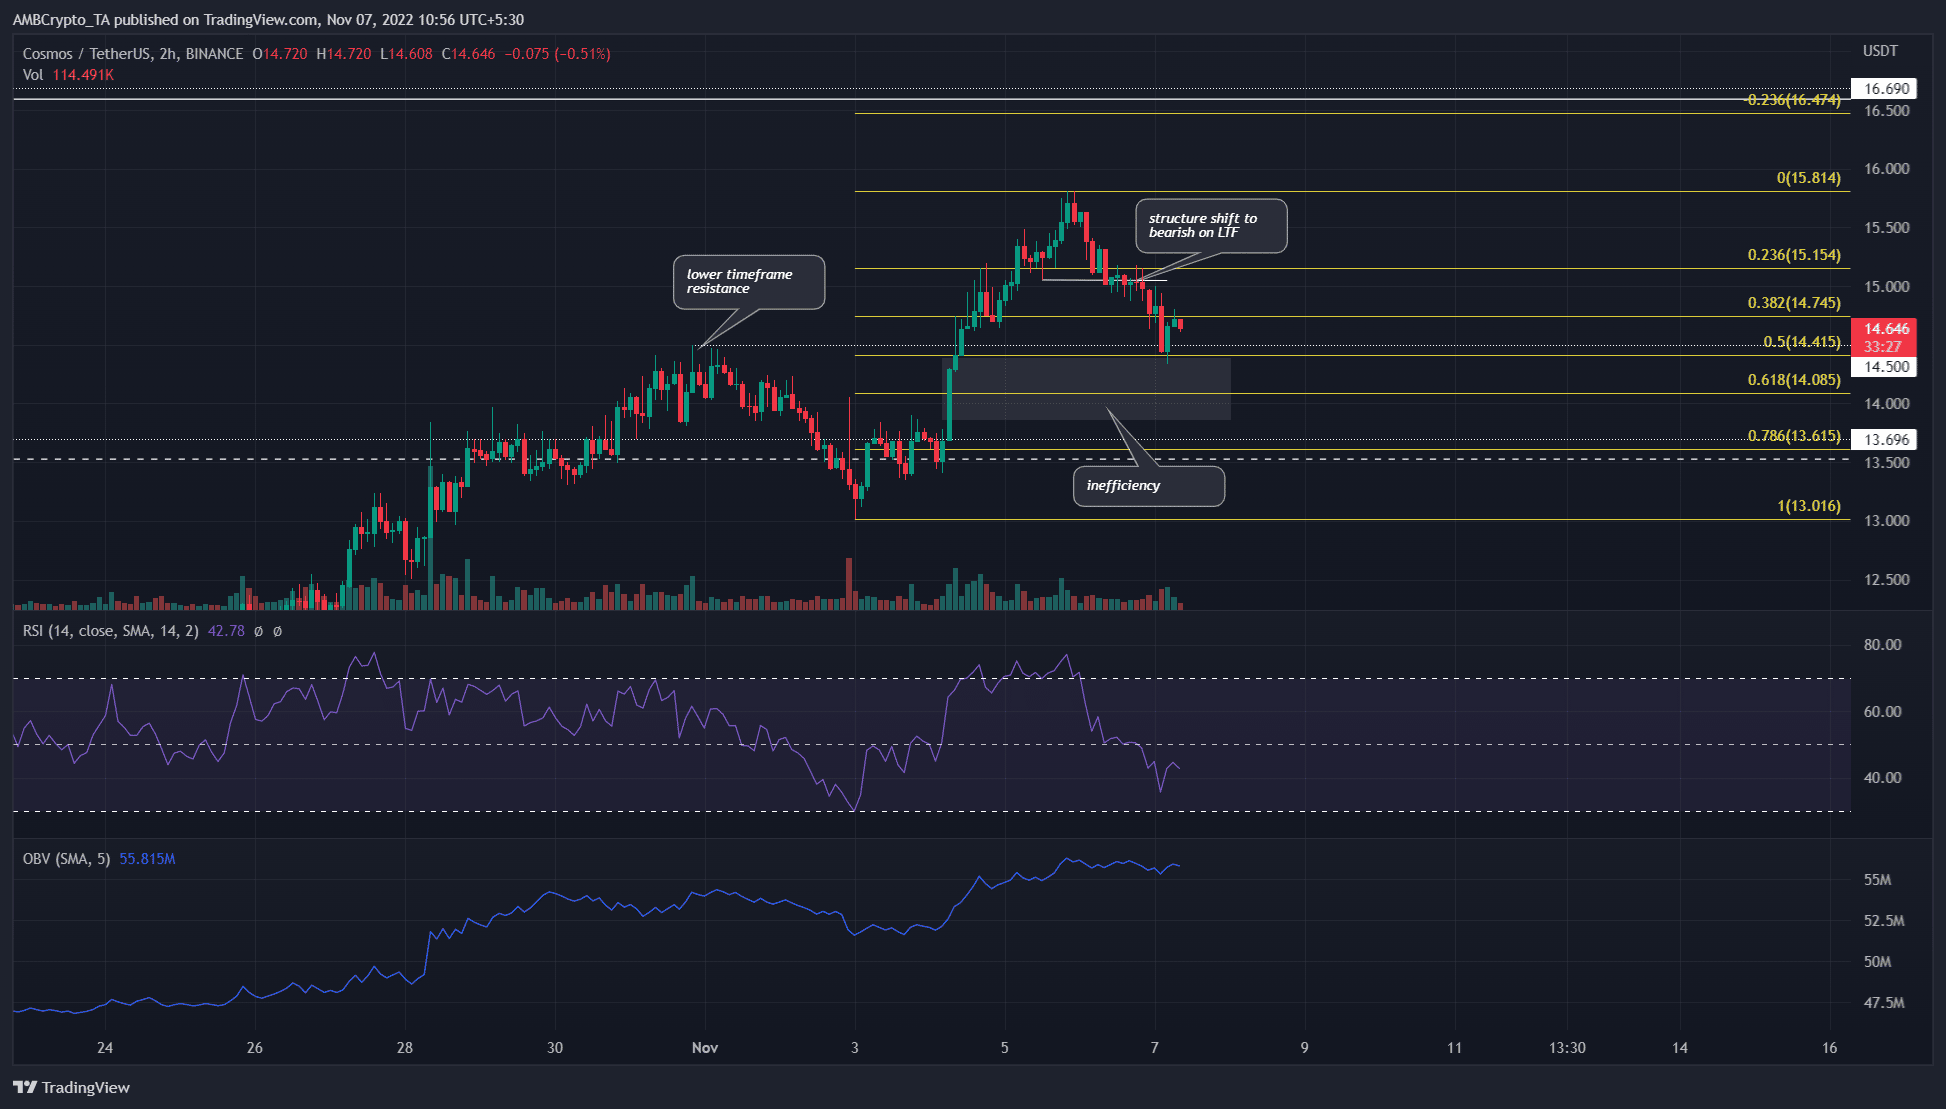
The two-hour chart showed that the market structure was flipped to the lower timeframe bearish. The dip beneath the swing low at $15 (white) indicated a pullback was in progress. A few hours later the price dropped to a low of $14.34. Despite the drop, the higher timeframe trend remained bullish.
A set of Fibonacci retracement levels (yellow) were drawn based on the move from $13 to $15.8. The 61.8% retracement level stood at $14. This had some confluence with an inefficiency ATOM displayed on its way up.
The move from $13.5 to $15.75 was quick, and a fair value gap was seen in the $13.85-$14.4 area (gray). Hence, it was likely that the price would run back into these levels before another move upward.
The Relative Strength Index (RSI) dropped below neutral 50 to show a bearish bias in the short term. Yet, the On Balance Volume (OBV) didn’t decline by an appreciable amount in the past couple of days. This suggested that the recent dip to $14.4 was only a pullback and not the reversal of the trend.
To the south, a higher timeframe support level lay at $13.5. This was the mid-range value, with the range high at $16.6. Once more there was a good confluence between the range highs and the 23.6% Fibonacci extension level at $16.47.
OI declines during the dip but the funding rate remains positive
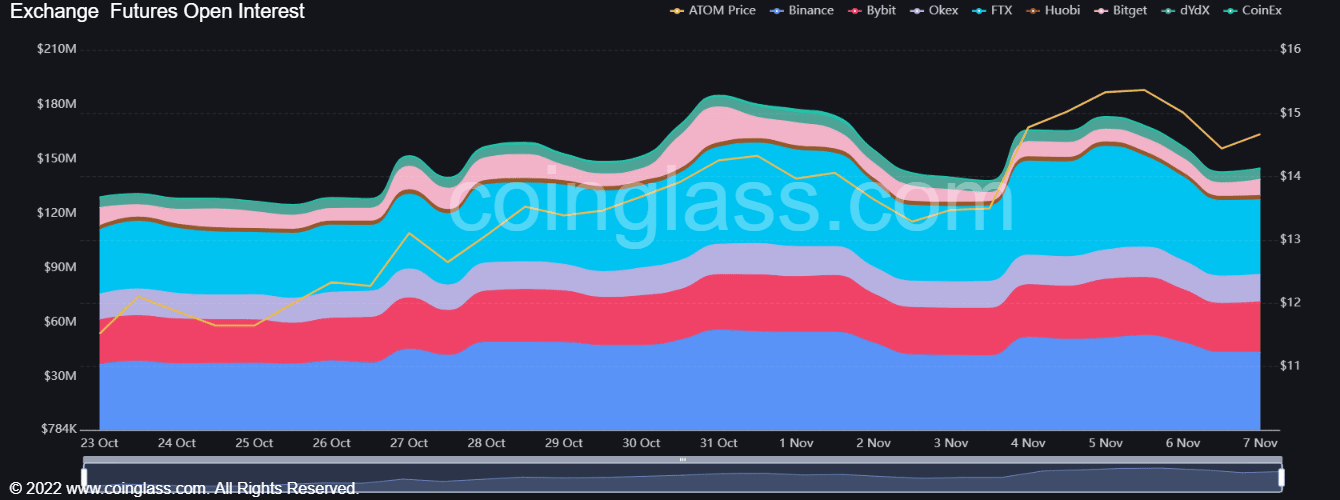 Source: Coinglass
ATOM’s rally from $13.5 saw a significant uptick in the Open Interest. In the past couple of days, the OI receded alongside ATOM’s pullback. This highlighted the possibility of long traders discouraged from the bullish outlook, but not necessarily a pullback.
The funding rate has been positive for ATOM over the past few days. The futures market participants remained in a bullish position. Furthermore, technical indicators showed short-term bearishness. On the other hand, the price action indicated a buying opportunity could be around the corner.