ATOM traders should expect these lows before the next rally

Disclaimer: The findings of the following analysis are the sole opinions of the writer and should not be taken as investment advice
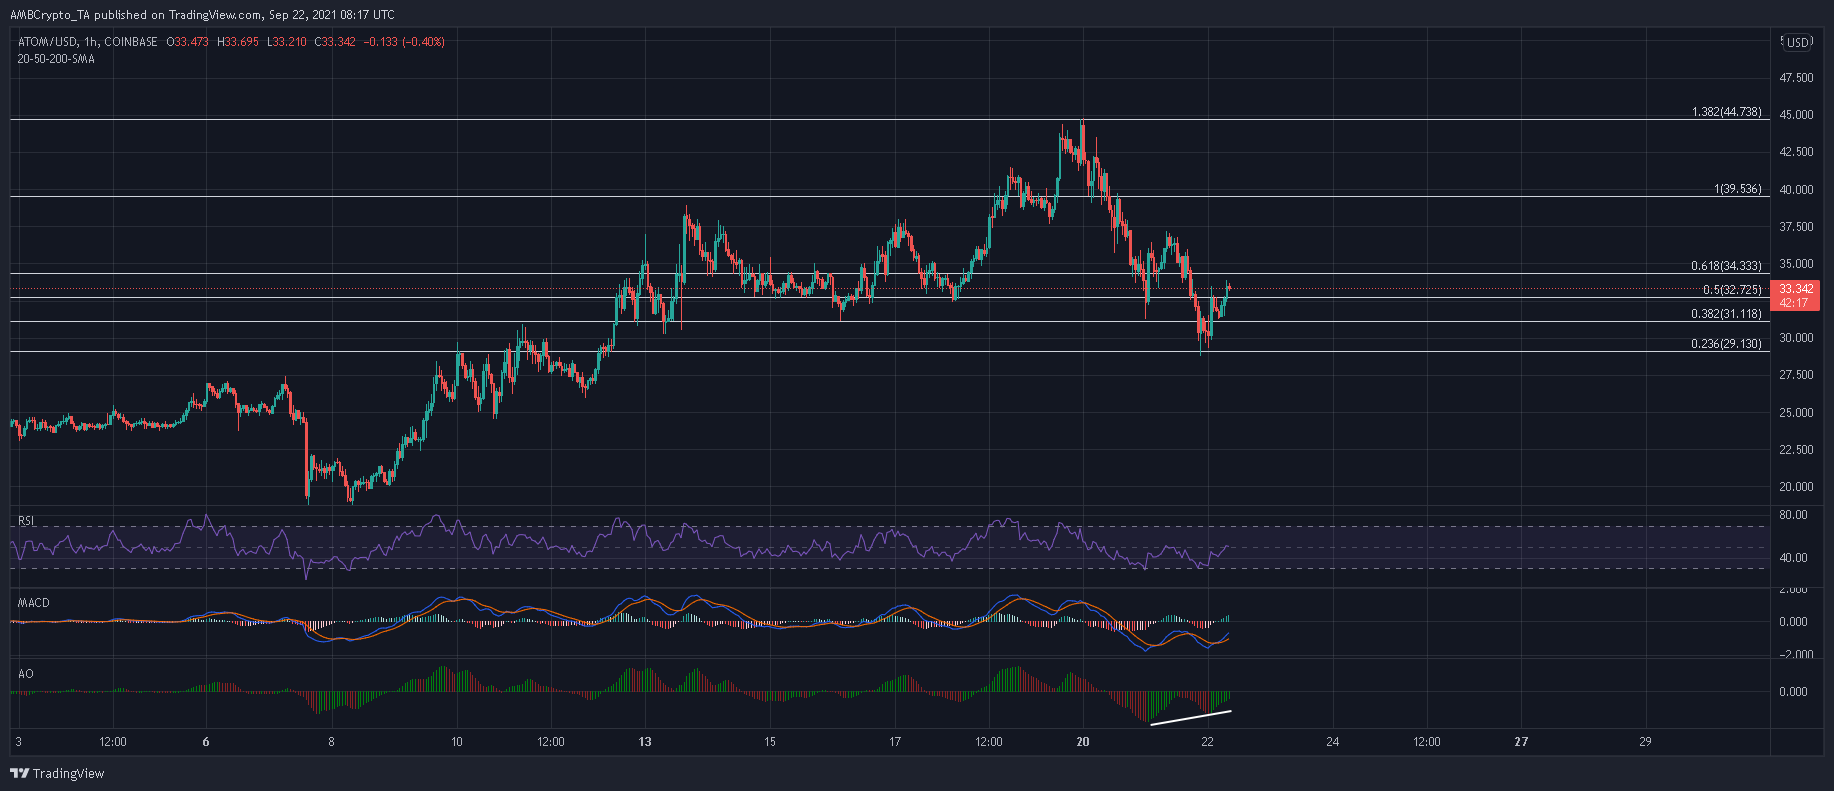
After touching record levels on Monday, Cosmos seems to have cooled down on the charts. The formation of lower lows and lower highs suggested that a corrective phase was in effect after a strong rally. Since sellers maintained control, ATOM can be expected to revisit the 23.6% Fibonacci level after a minor recovery.
At the time of writing, ATOM was trading at $33.3, down by 8% over the last 24 hours.
ATOM Hourly Chart
A look at ATOM’s chart highlighted an impulsive wave that began from the $17-mark and peaked at an ATH of $44.8. After a 160% hike in less than two weeks, a corrective phase was observed as ATOM closed below multiple Fibonacci levels.
However, at the time of writing, ATOM was able to recoup its losses after bouncing back from the 38.2% Fibonacci level.
While some gains are not uncommon during such a phase, they are usually short-lived. Hence, the press time resurgence can be expected to be only temporary and limited to the 61.8% Fibonacci level. When the next wave of selling pressure hits the market, the 23.6% Fibonacci level would be in focus once again.
A move towards the $26-level is also possible in case of an extended sell-off. On the plus side, a double bottom formed at $29.1 could lay the foundation for the next rally.
Reasoning
Since ATOM was on a downtrend, the hourly RSI can be expected to find resistance around its mid-line and move lower once again. This translated to further losses in the coming days. Even though the MACD was close to a bullish crossover, the same was still trading below the half-line and attracted more selling behavior.
Finally, the Awesome Oscillator presented a more optimistic scenario. A bullish twin peak formed on the AO – A sign that buying pressure was on the rise. If buyers latch on to this signal and trigger a close above $37.1, market control would switch back to the bulls.
Conclusion
ATOM can be expected to revisit the 23.6% Fibonacci level as sellers trigger further drawdowns. A close below the aforementioned level would bring the $26 support into play.
On the other hand, a bullish outcome can be expected in case some of ATOM’s indicators climb above key areas. Closing above 21 September’s swing high of $37.1 would be considered as the best-case scenario.


