Avalanche [AVAX] bulls can steer through this bearish breakout

The liquidations from Avalanche’s [AVAX] previous symmetrical triangle pulled the alt below its eight-month trendline support (previous resistance).
But the market-wide growth aided the bulls in fixating a position above the $21-level. Besides, the recent patterned breakdown could slow down the near-term bullish momentum.
Should the buyers be adamant about defending the$21-level, AVAX could see a low volatility phase before any revival chances. At press time, AVAX traded at $22.47, down by nearly 14% in the last 24 hours.
AVAX Daily Chart

AVAX lost more than 90% of its value since its ATH and plunged toward its ten-month low on 19 June. Then, the bulls were quick to reclaim a spot above the trendline support (yellow, dashed). This comeback saw reversal tendencies from the $30-$31 range resistance.
The recent rising wedge breakdown inflicted an uptick in selling volumes while AVAX plunged below its EMA ribbons.
With the price action approaching the $20-$21 support range, the buyers would aim to look for rebounding opportunities.
Here, the potential targets could lie in the $24-zone. However, an inability of the buyers to step in would encourage the ongoing dullness.
In which case, AVAX could enter into a squeeze phase in the coming times.
A compelling close below the $20-support would open up shorting opportunities bearing the target in the $16-$18 range. The traders must carefully assess the implications of the macroeconomic factors on the market sentiment.
Rationale
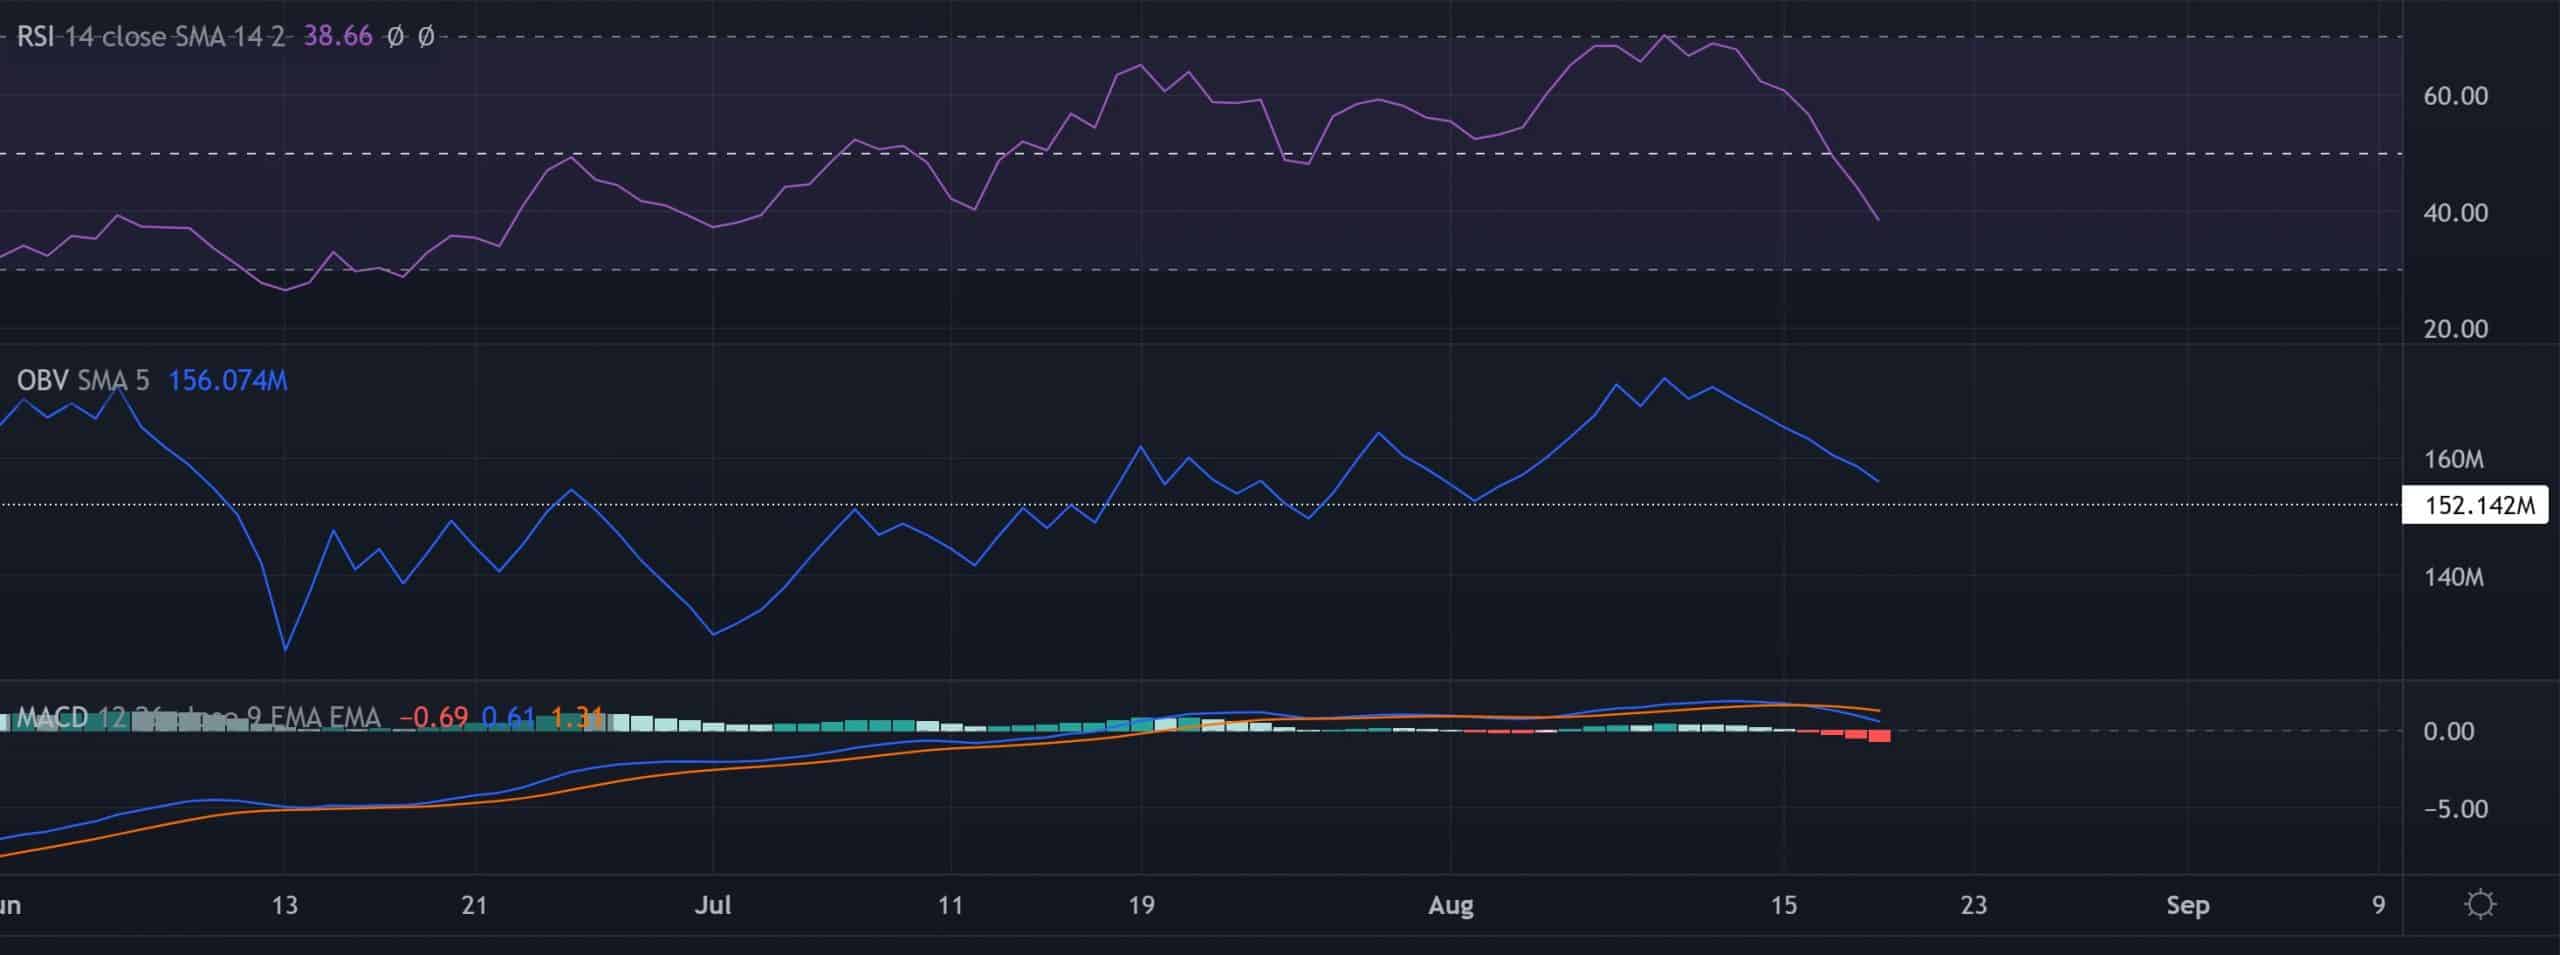
After snapping the midline support, the RSI fell in the bearish region and eyed to enter the oversold region. The bulls still had a long way to turn the tides to their fancy.
While the OBV seemingly maintained its support level, any bounce-backs could provoke a near-term bullish push. The traders must watch out for a rebound before placing calls.
Further, the MACD bearish crossover reaffirmed the bearish strength, but the lines were yet to drop below the midline to depict a one-sided bearish edge.
Conclusion
Owing to the immediate support range in the $20-$21 zone, the buyers would hope for a plausible revival. But a bearish crossover on the EMA ribbons could only provoke sluggishness in the near future. The targets would remain the same as discussed.
Finally, the investors/traders must keep a close watch on Bitcoin’s movement. This reading would be vital to complement these technical factors.


