Avalanche [AVAX]: How investors can make the most out of this pattern’s break
![Avalanche [AVAX]: How investors can make the most out of this pattern's break](https://ambcrypto.com/wp-content/uploads/2022/07/Untitled-design-17.png)
Disclaimer: The findings of the following analysis are the sole opinions of the writer and should not be considered investment advice.
Over the past week, the altcoin market saw a gradual recovery while the bulls stepped up their pressure. Avalanche [AVAX] found a convincing close above its EMA ribbons in the four-hour timeframe.
But with the seven-week trendline resistance (white, dashed) curbing the buying rallies, the sellers have kept a check on the alt’s peaks. A robust close below the current pattern could propel a near-term drawdown in the coming days. At press time, AVAX traded at $20.02.
AVAX 4-hour Chart
AVAX shed more than 58% of its value (from 23 May) and dived toward its ten-month low on 19 June. Since then, buyers have held on to the $15.95 grounds while provoking two up-channel recoveries over the last few weeks.
The altcoin’s price has been struggling to find a trend-altering rally while sellers re-established their vigor at trendline resistance. For over three weeks now, this resistance has offered rebounding opportunities for the sellers.
With the EMA ribbons looking north, the buyers controlled the immediate trend. However, the price action now approached its trendline resistance and the 200 EMA (green). So, a likely reversal from the $20-zone could cause a pullback.
A sustained close below the up-channel could pull AVAX to retest the $19.1-mark in the coming sessions. Any close below this level would only affirm the selling narrative. To change this outlook, the bulls still had to find a break above the $20-mark and the trendline resistance.
Rationale
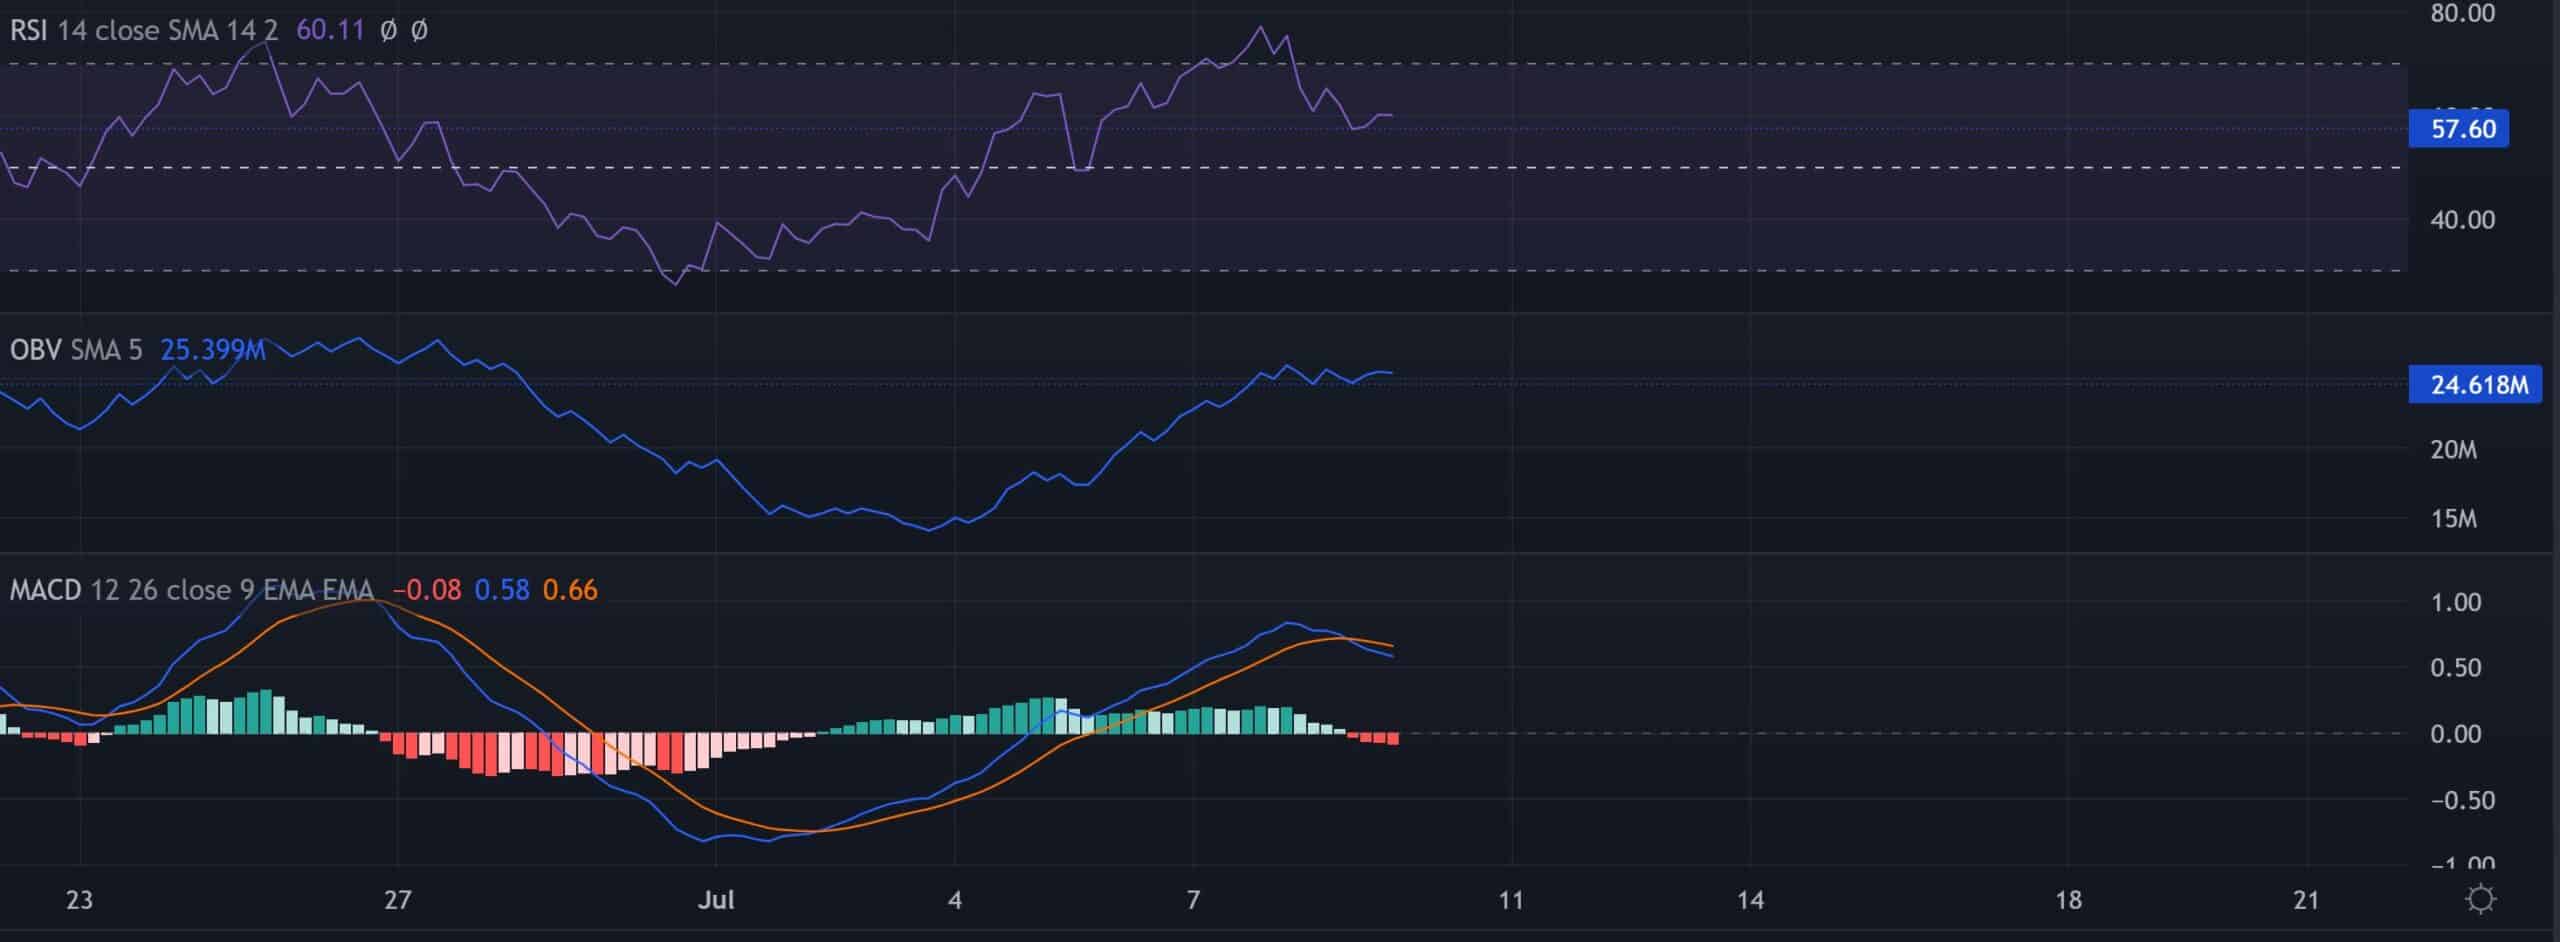
The Relative Strength Index (RSI) has resonated with the recently increased buying power by maintaining its position above the midline. A continued trajectory above the 56-support could aid the buyers in preventing a drop below the EMA ribbons.
The On-Balance Volume (OBV) has also iterated an increase in buying power, particularly over the last four days. But the Moving Average Convergence Divergence (MACD) saw a bearish crossover and suggested ease in the buying pressure. A continued southward tendency below the zero-mark could impair the buying comeback possibilities.
Conclusion
AVAX walked on thin ice at press time. A fall below the pattern could aggravate the selling inclinations. In this case, the targets would remain the same as above.
However, a broader sentiment analysis alongside on-chain developments should be taken into consideration to make a profitable move.


![Aptos [APT]](https://ambcrypto.com/wp-content/uploads/2025/06/Gladys-12-1-400x240.webp)


