Avalanche [AVAX]: Is demand strong enough to reverse the downtrend

Disclaimer: The findings of the following analysis are the sole opinions of the writer and should not be considered investment advice
Avalanche dropped below the $40 support area as the wave of selling intensified in May. The downtrend might not be at an end, amidst macroeconomic fears around inflation and Bitcoin being a risk-on asset in uncertain times. Long-term investors might look at the $25 support area and see a great opportunity to buy the asset, but it has to be remembered that sometimes it is better to buy strength than to buy weakness.
AVAX- 12 Hour Chart
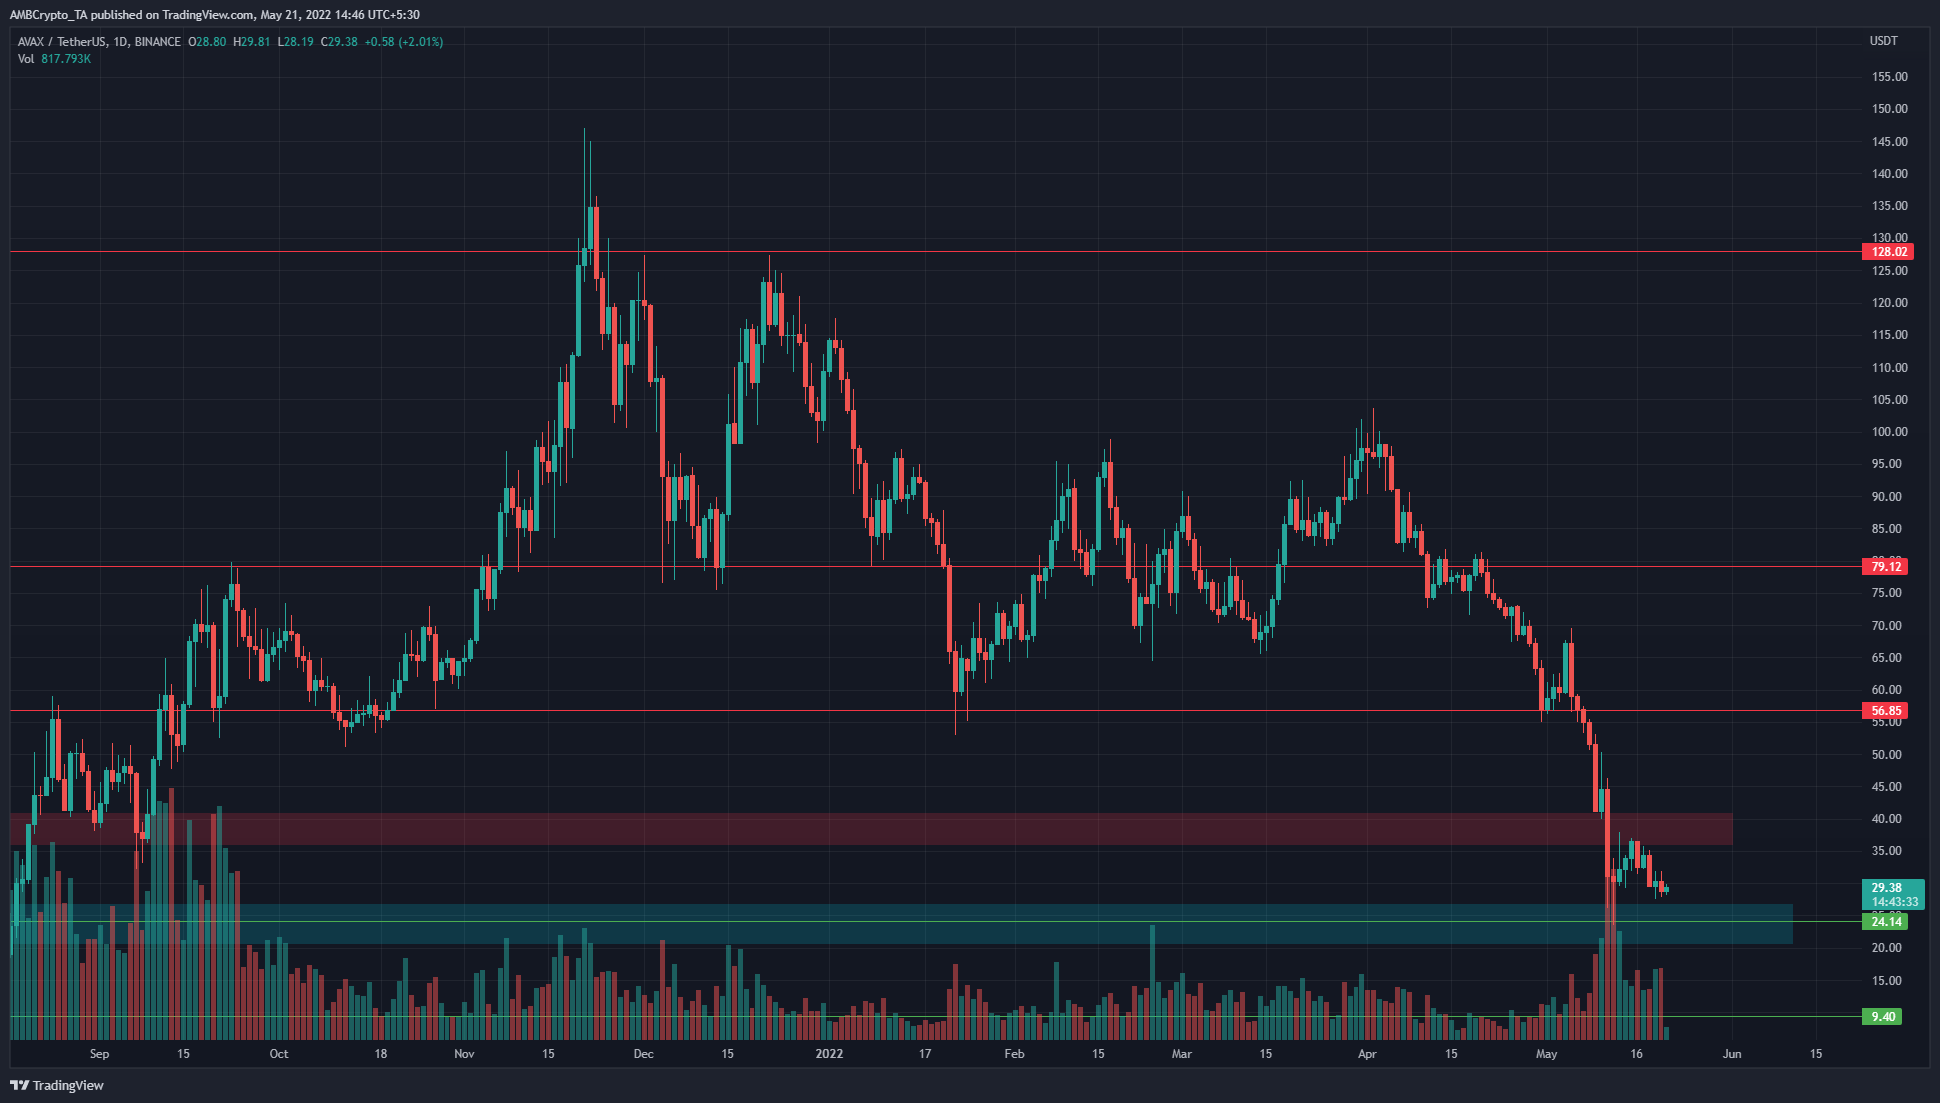
The $24.14 level of support is a level that AVAX last traded at in August 2021. At that time, AVAX was in a strong uptrend, and broke past this level and straight to $56, before retesting the $40 area as demand.
The $24 and $40 areas of support and resistance had been established earlier, in February, and at the time of writing, these are the two areas that long-term investors of AVAX would need to watch out for.
Is AVAX at $24 a bargain buy? It could be, for short-term scalpers. However, long-term investors might not be so sure. Beneath the $20-$24 area, the next major long-term support lies at the $9-$12 area, which represents yet another 50% loss.
Rationale
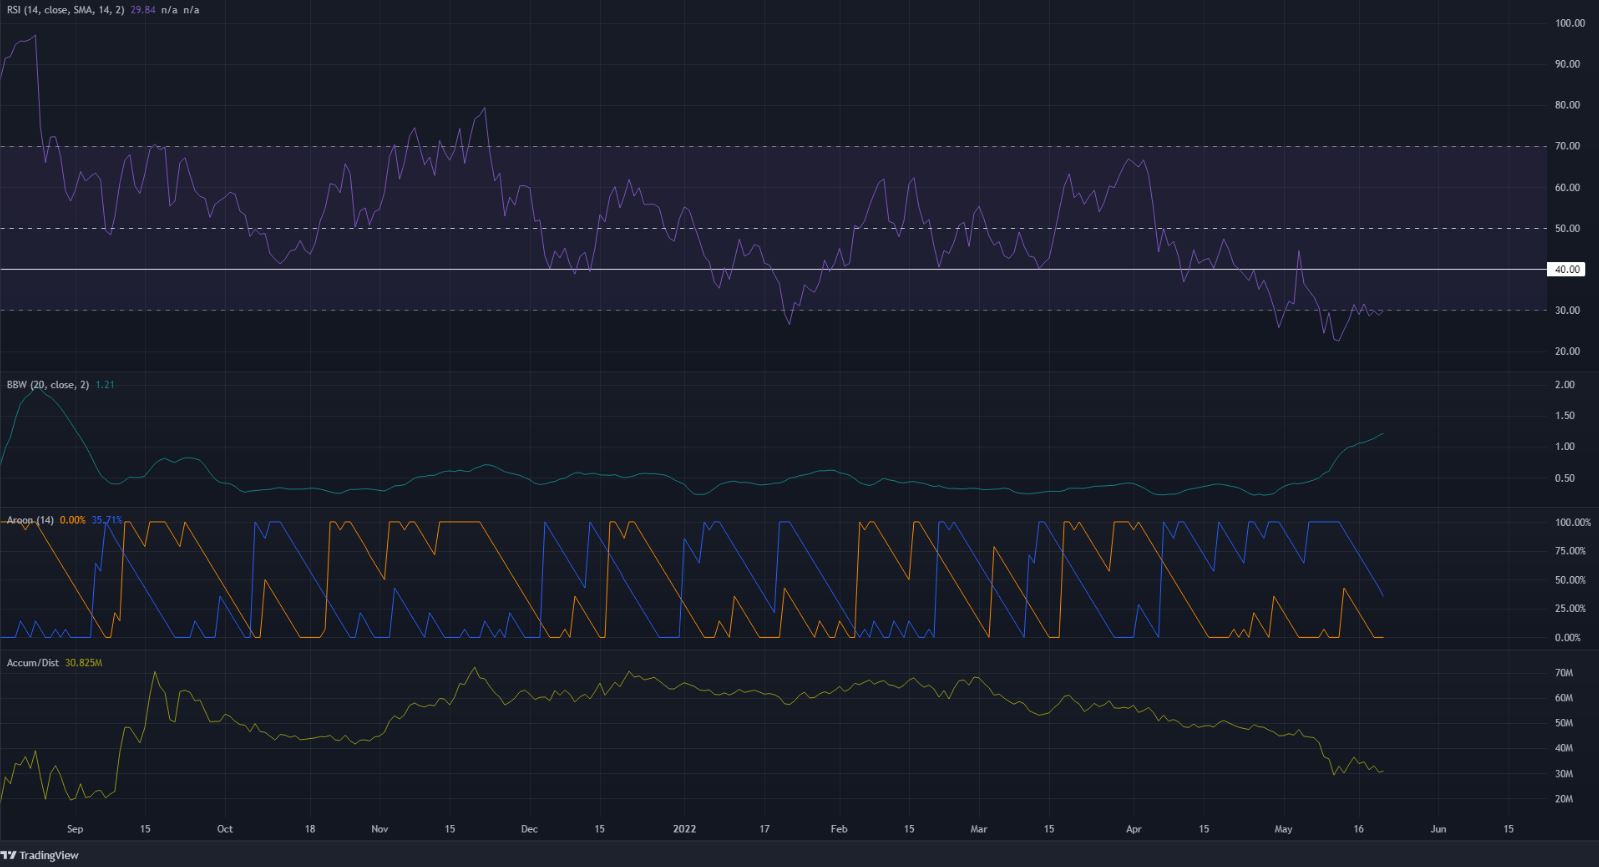
The daily RSI was at 29.8, to show strong bearish momentum. Despite the bounce from $24.14 to $$37, the RSI did not really climb above the 30 mark. Further north, the 40 level could pose resistance and rejection, and further bearish pressure could become evident for AVAX in the days/weeks to come.
The Bollinger Bands width indicator has been climbing in recent weeks, in reflection of the strong move downward that AVAX saw. The Aroon Indicator showed a steady downtrend since April as the Aroon Down (blue) dominated. The A/D also slid lower and lower in the past two months to show greater selling pressure.
Conclusion
A risk-averse investor would want to see some strong demand and the build-up of bullish strength behind an asset before feeling confident enough to buy an asset. As things stand, the technical structure of AVAX was bearish and an accumulation phase did not seem to be on yet.


