
With Bitcoin’s 4-hour 20 EMA jumping above its 50 EMA, Avalanche, Bitcoin Cash, and FLOW projected bullish technicals in the near term. The latter two of these cryptos saw a patterned breakout as the bulls countered the selling pressure.
Avalanche (AVAX)
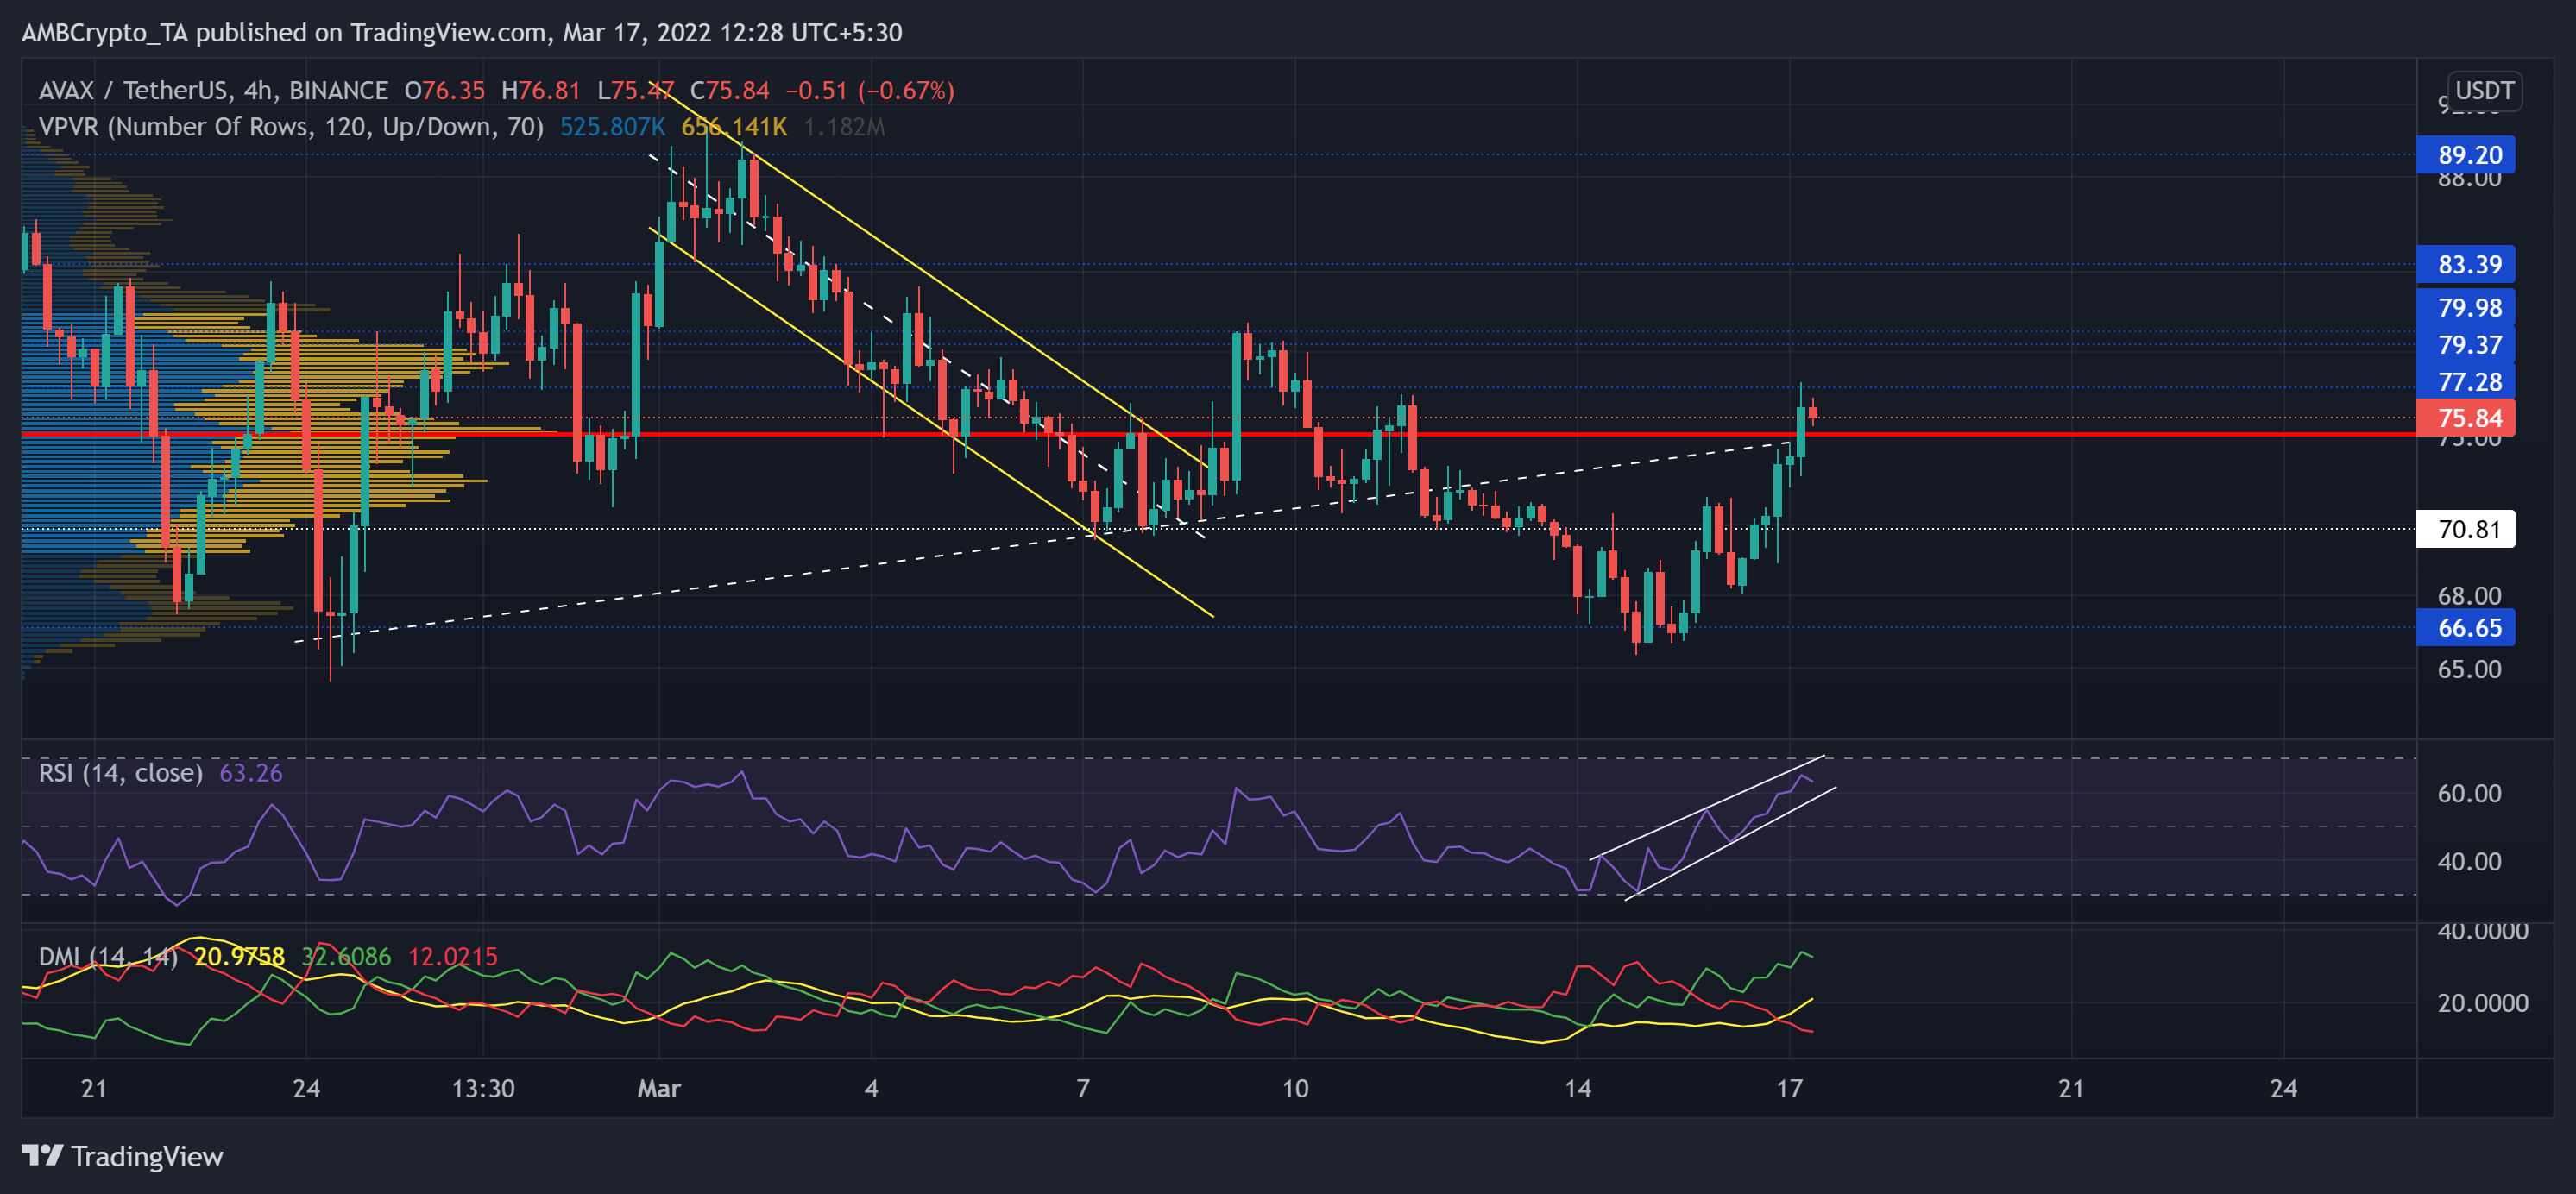
Source: TradingView, AVAX/USDT
As the bulls finally stalled the January sell-off, AVAX saw a staggering 85.2% ROI until 17 February. Since then, it has found an oscillation range between the $96-$66 mark.
The most recent bearish phase marked a down-channel (yellow) that led AVAX below its Point of Control (red, POC) and its trendline support (white, dashed). But, in light of the increasing bullish vigor over the last two days, the alt saw an over 15% jump on its charts. Consequently, AVAX reclaimed its POC while testing the $77-mark.
At press time, AVAX was trading at $75.84 after noting 9.62% 24-hour gains. The bullish RSI saw a 26-point surge in two days. Any near-term pullback from here could find testing support near the lower trendline of its rising wedge. Also, with the gap between the DMI lines overstretched, the bulls had a near-term edge before a possible pullback.
Bitcoin Cash (BCH)
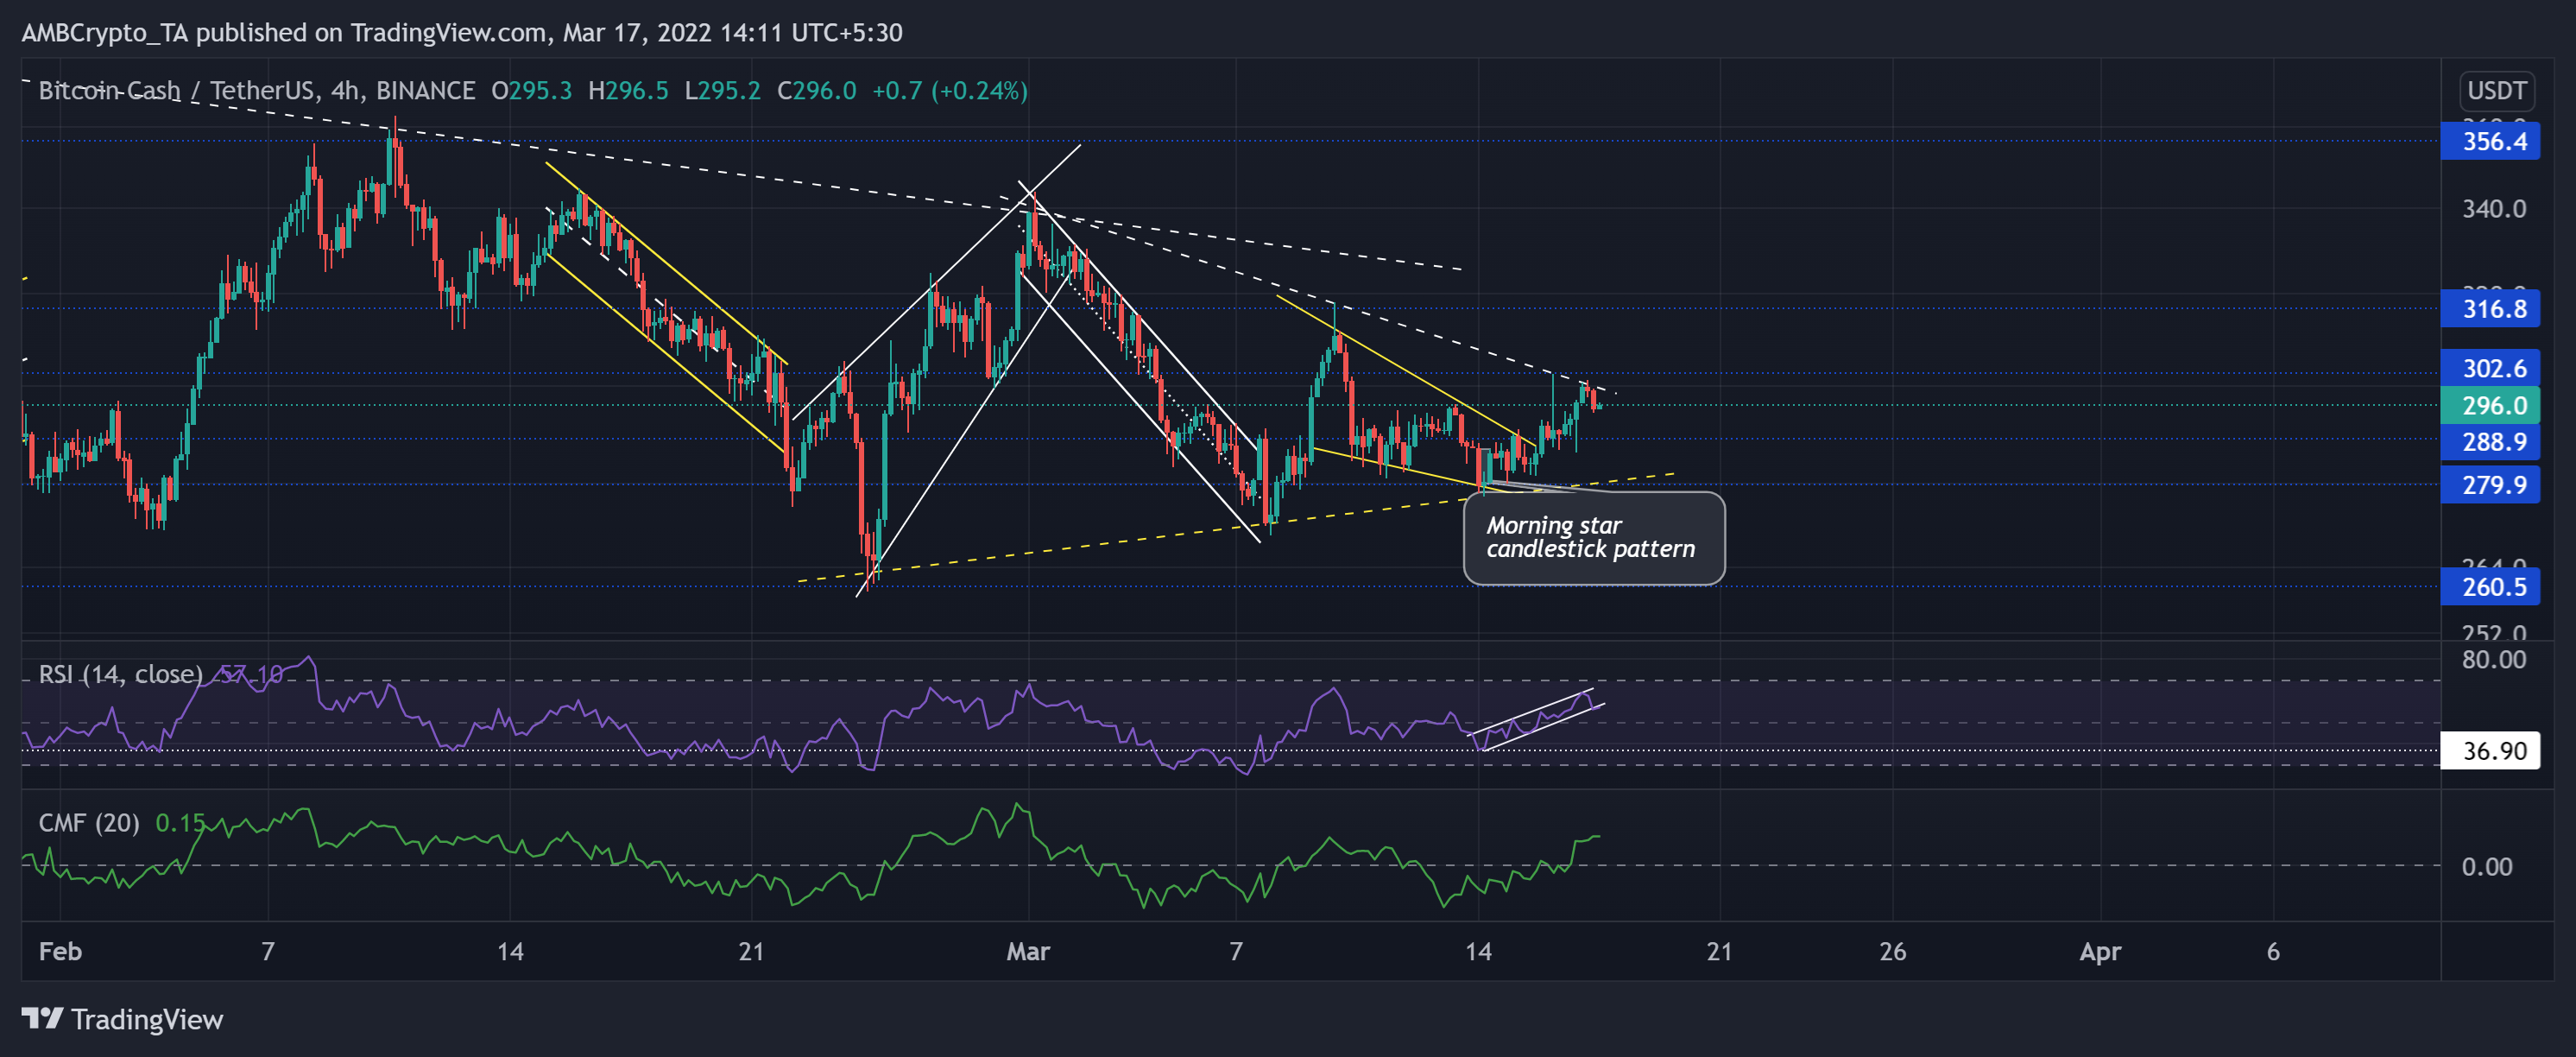
Source: TradingView, BCH/USDT
As the bearish phase heightened, BCH sharply fell and lost its year-long support (now resistance) at the $356-mark. After an over 28% retracement (from 10 February), the alt matched its January lows.
The latest retracement saw a falling wedge (white) that yet again tested its trendline support (yellow, dashed). Also, BCH saw a morning star candlestick pattern that propelled a patterned breakout towards the $302-mark.
At press time, BCH traded at $296. The RSI grew between an up-channel and found a close above the midline. Over the last few hours, it broke down the pattern as the bears tried to counter the buying power. Also, the CMF affirmed the bullish edge as it swayed sideways above the zero-line. This reading entailed the increased money flows into BCH over the past two days.
FLOW
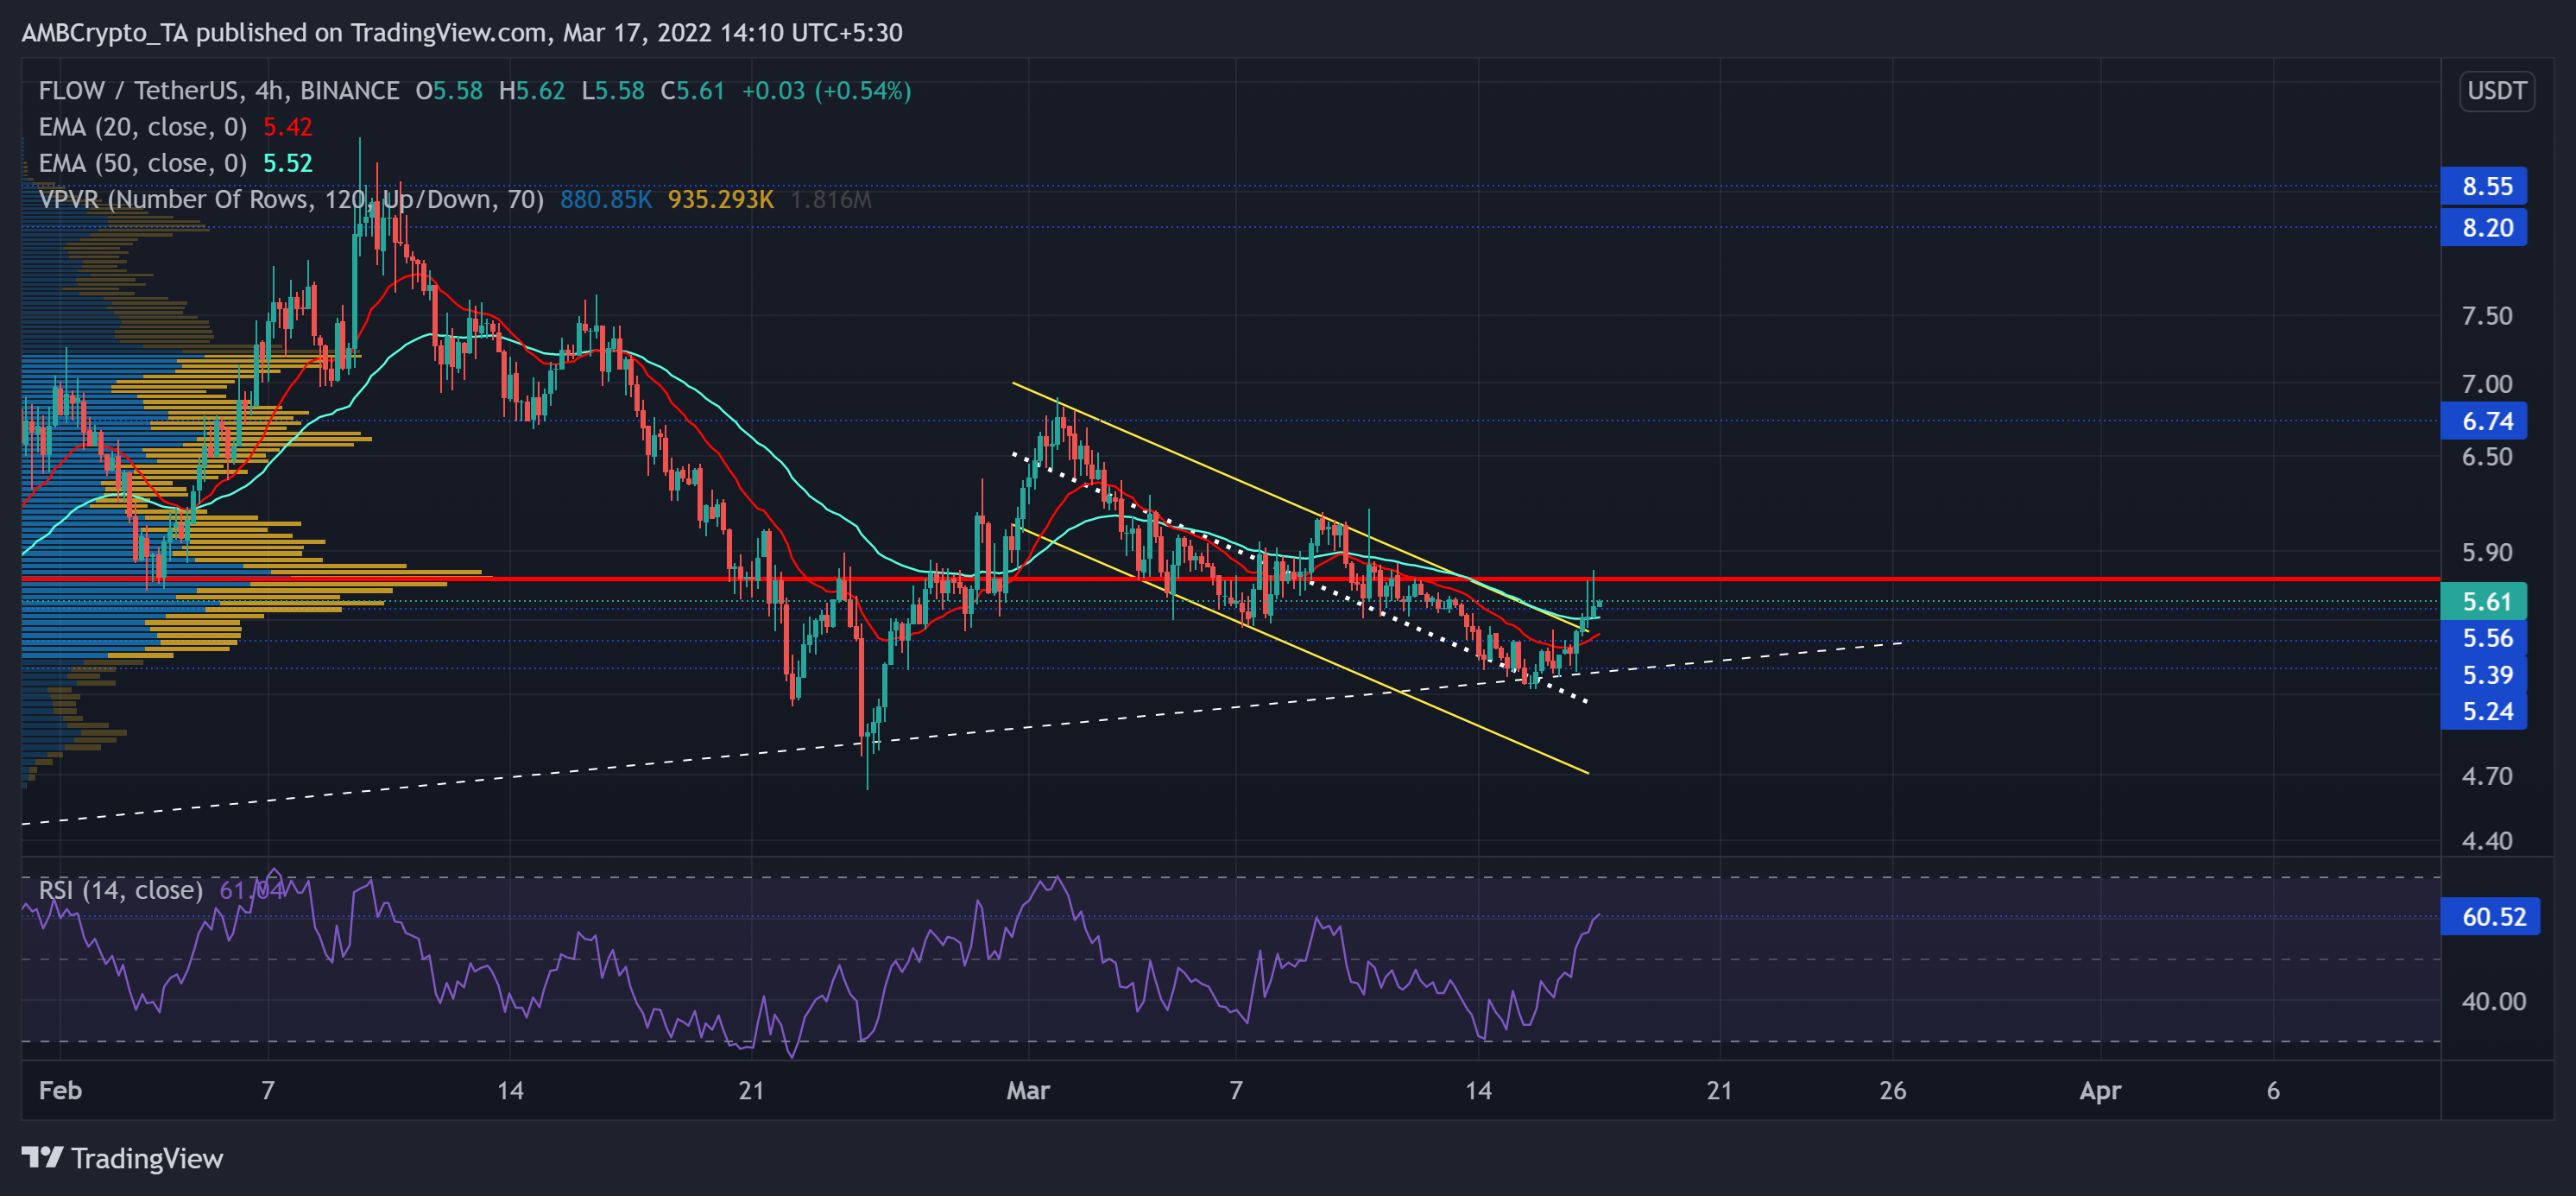
Source: TradingView, FLOW/USDT
FLOW has been on a constant decline since August last year. The bulls have been on a perpetual back foot until the alt touched its January lows.
After losing the vital $8.2-mark on 6 January, FLOW lost over half its value and touched its All-time low on 24 January. Since then, it has been on a gradual recovery while reclaiming the $5.2-base. The recent bullish phase pushed the alt above its 20/50 EMA while breaking out of its down-channel (yellow). Now, the Point of Control (red) continued to offer immediate resistance for the alt.
At press time, FLOW traded at $5.61. The RSI saw exponential growth from the oversold region. Now, a sustained close above the 60-mark could open up gates for an overbought territory retest.