Avalanche – Here’s what’s next for AVAX on the charts

Disclaimer: The findings of the following analysis are the sole opinions of the writer and should not be taken as investment advice
A double top coupled with overbought readings on the RSI has led to recent downturns in Avalanche’s market. While its latest decline may be considered as just a corrective phase similar to the one observed on 13 September, there were some key differences.
If bearish readings hold up on some of AVAX’s indicators, some lows can be expected in the coming days with a possible revisit of the $50-mark. At the time of writing, AVAX was trading at $61.7, down by 2% over the last 24 hours.
Avalanche 4-hour Chart
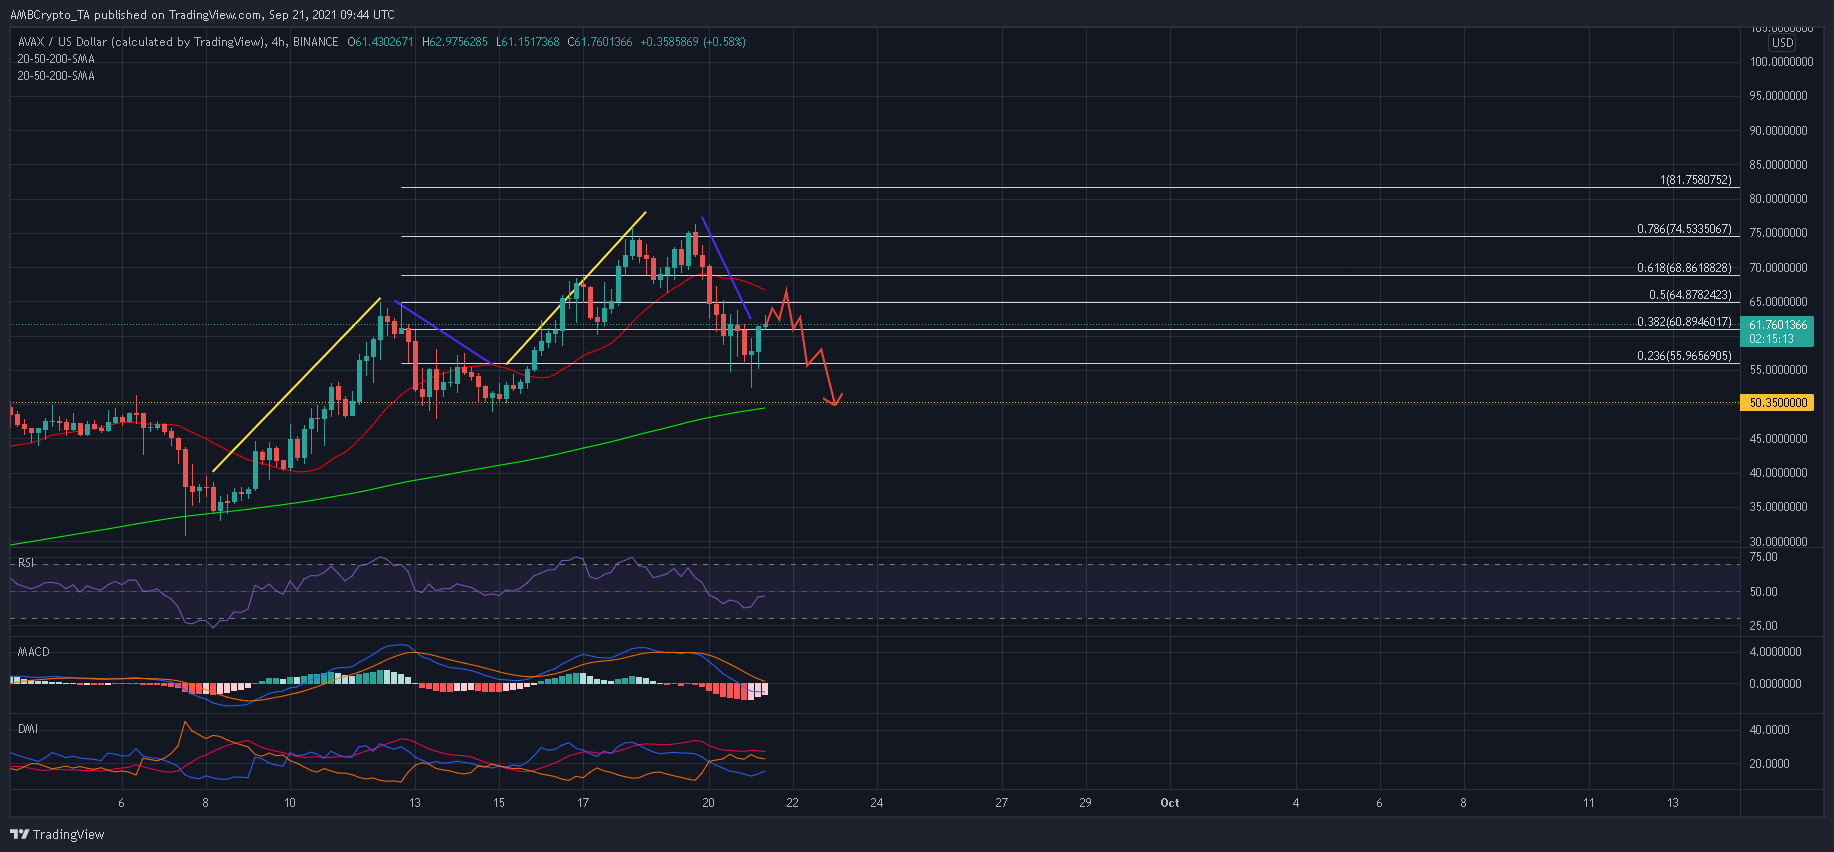
Impulsive waves normally comprise of smaller waves that move in the same direction as a general trend. In this case, AVAX’s run from $33.4 to the 50% Fibonacci level and then above the 78.6% Fibonacci level can be considered an impulsive wave consisting of a few ‘sub-waves.
These sub-waves also comprise correctional phases (outlined by blue trendlines) which are usually short-lived. Now, taking AVAX’s correction from the 50% Fibonacci level to $47.8 into consideration, a similar decline may have unfolded across the market.
What’s more, a few green candlesticks were emerging at the 23.6% Fibonacci level. This suggested that AVAX may be entering a fresh up-wave.
Even so, on the back of a near 26% decline in both corrective phases, the press time scenario was somewhat different. AVAX’s indicators fell below key levels and sellers had more control over market proceedings.
Reasoning
The 4-hour RSI and MACD, at the time of writing, were both below their mid-lines and in bearish territory. This was not the case during AVAX’s previous correction, one which saw the RSI and MACD find support at their equilibrium marks.
What this meant was that the latest retracement carried more venom than the last. To expand on this further, the DMI witnessed a bearish crossover for the first time since 7 September. Now, even though AVAX did recoup some of its losses, buying behavior could just be reactionary. Ergo, the price might still be at the risk of a decline.
If the 23.6% fails to trim selling pressure, AVAX would look to find support around the $50-mark. This is a zone that has been backed by the 4-hour 200-SMA (green).
Conclusion
AVAX can be expected to move south after pairing some losses. The price could briefly pick up towards the 20-SMA, but expect sellers to hit back with more selling pressure. In such a situation, the support present around $50 would be critical to AVAX’s short-term trajectory.
To overturn this outlook, AVAX would need to extend above the 100% Fibonacci Extension level as part of a bigger impulsive wave.


