Avalanche [AVAX]: Mapping out the odds of a continued uptrend

After observing a swift up-channel (yellow) rally for over three months, Avalanche (AVAX) struck its ATH on 21 November. Since then, it marked a four-month bearish trendline resistance that the bulls recently flipped to support.
Now that it closed above its long-term liquidity range (Point of Control/POC), AVAX eyed to test the $95-$98 zone before facing a possible resistance in that area. Following this, the bearish attempts to pull the alt back would likely find a cushion in the $86-$89 range that assumed its demand zone. At press time, AVAX traded at $94.74, up by 3.7 % in the last 24 hours.
AVAX Daily Chart
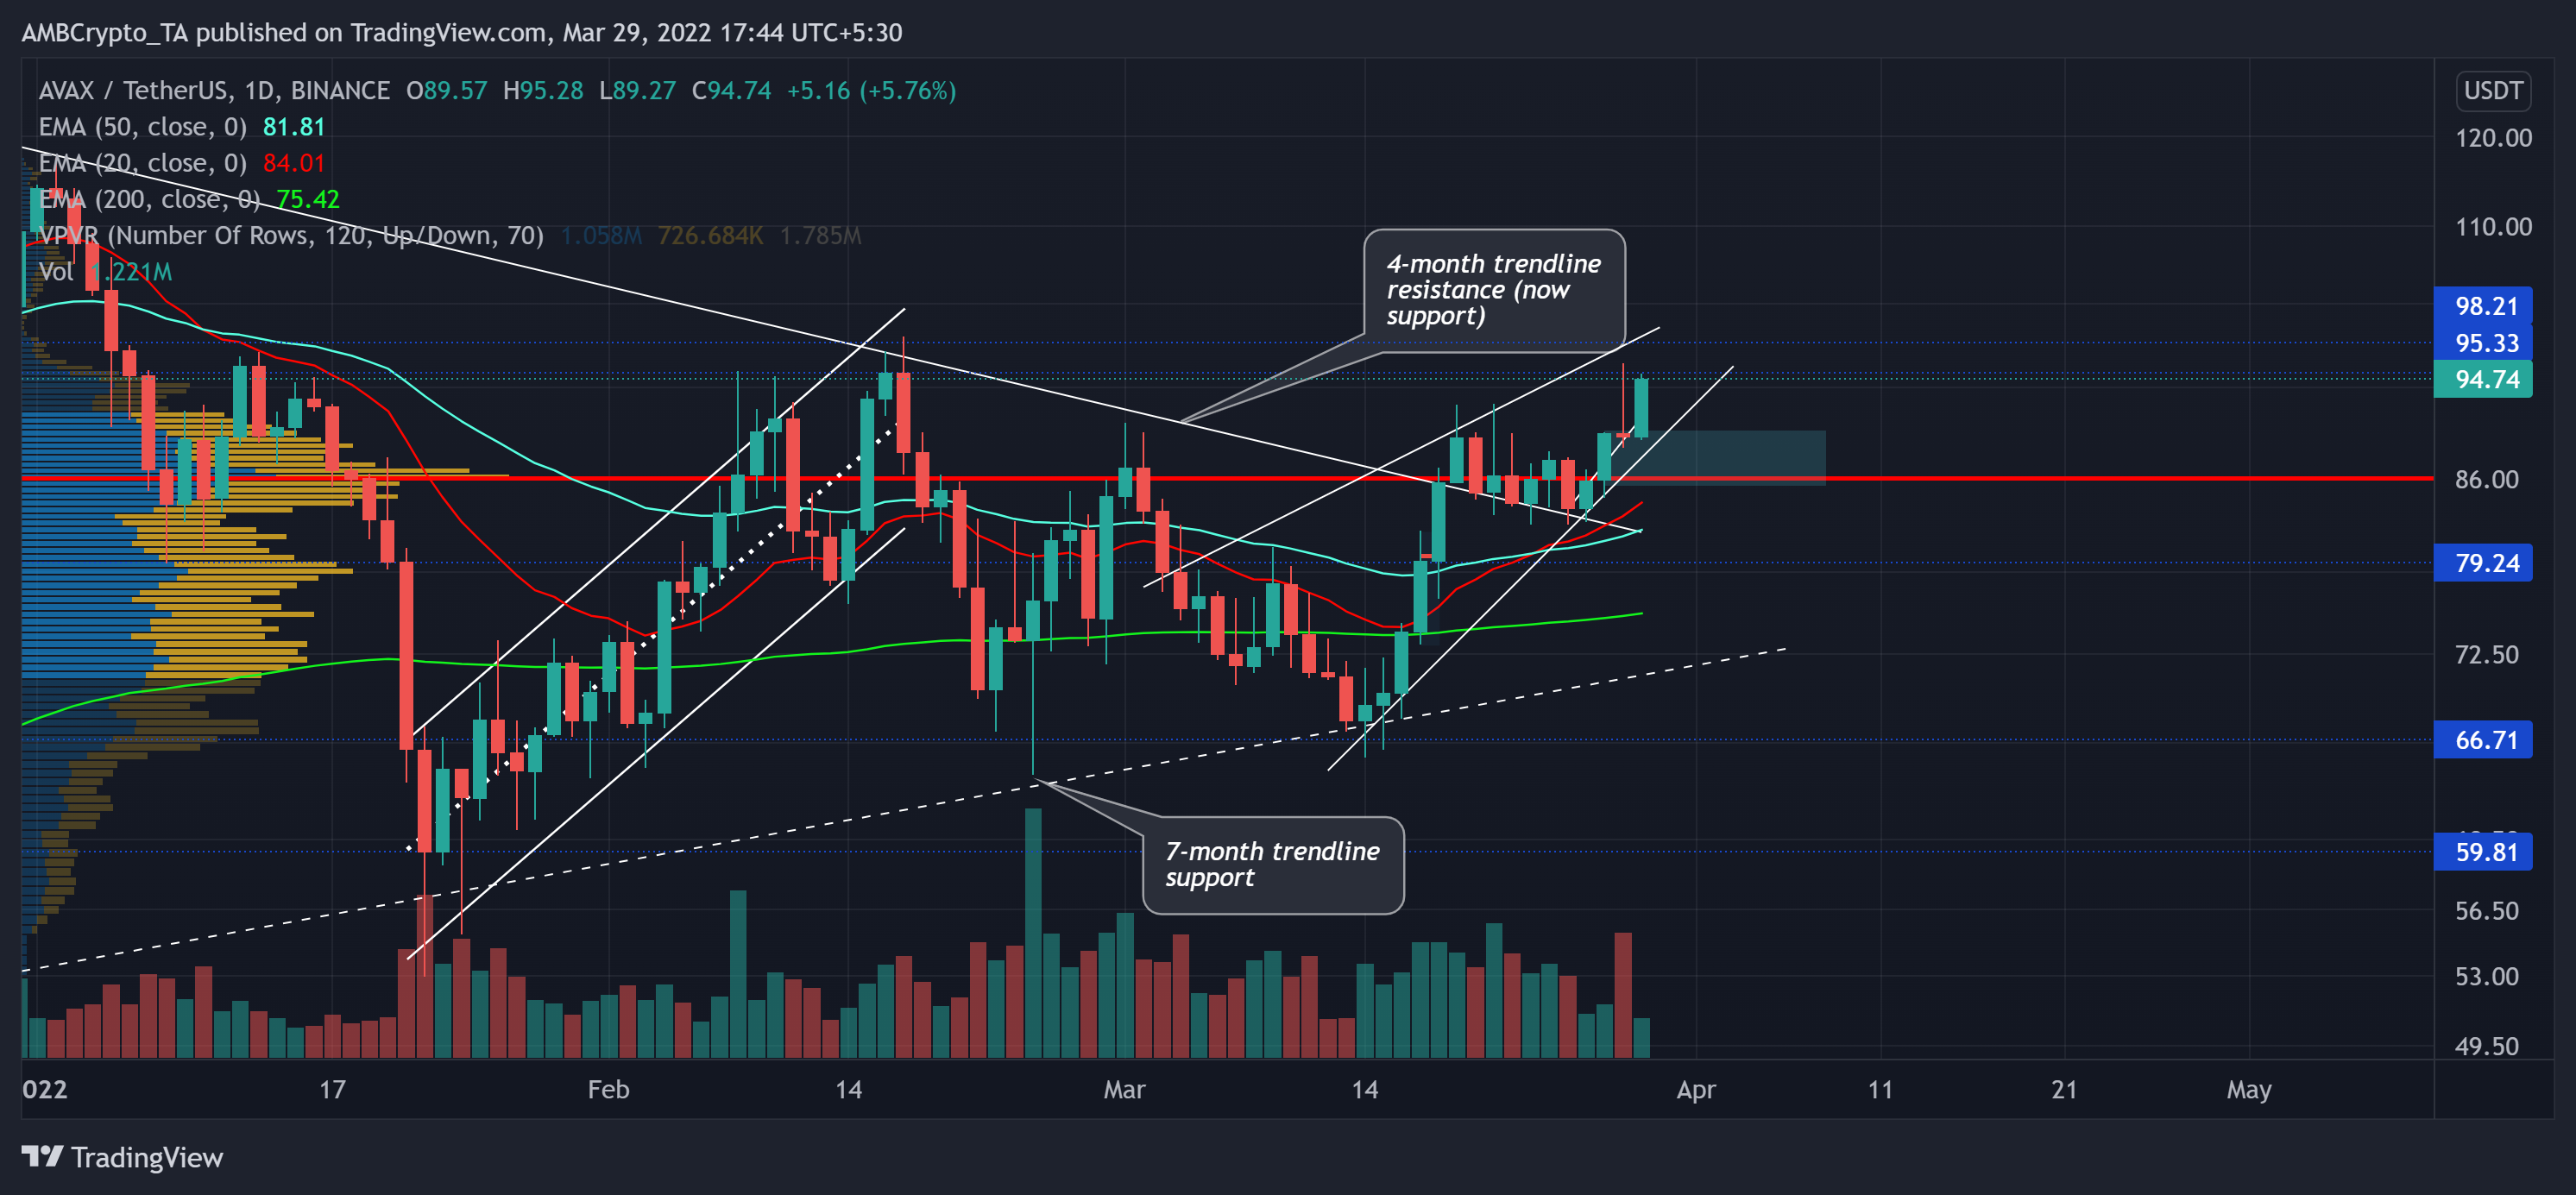
Since attaining its lifetime milestone, AVAX lost more than 64% of its value and plunged towards its 14-week low on 22 January. Then, while recovering its losses, the alt tested its trendline resistance (white) multiple times until the bulls breached it on 19 March.
The recent bull rally from its long-term support propelled a 43.8% ROI over just three weeks. Consequently, the 20 EMA (red) finally jumped above the 50 EMA (cyan) as the bulls take charge of the current trend.
Going further, a test of its immediate resistance range seemed likely before facing a pullback. Also, with the 20 EMA still eyeing north, possible retracements could be short-lived by its POC. The bulls would need to ramp up their volumes to sustain a rally above the $95-mark.
Rationale
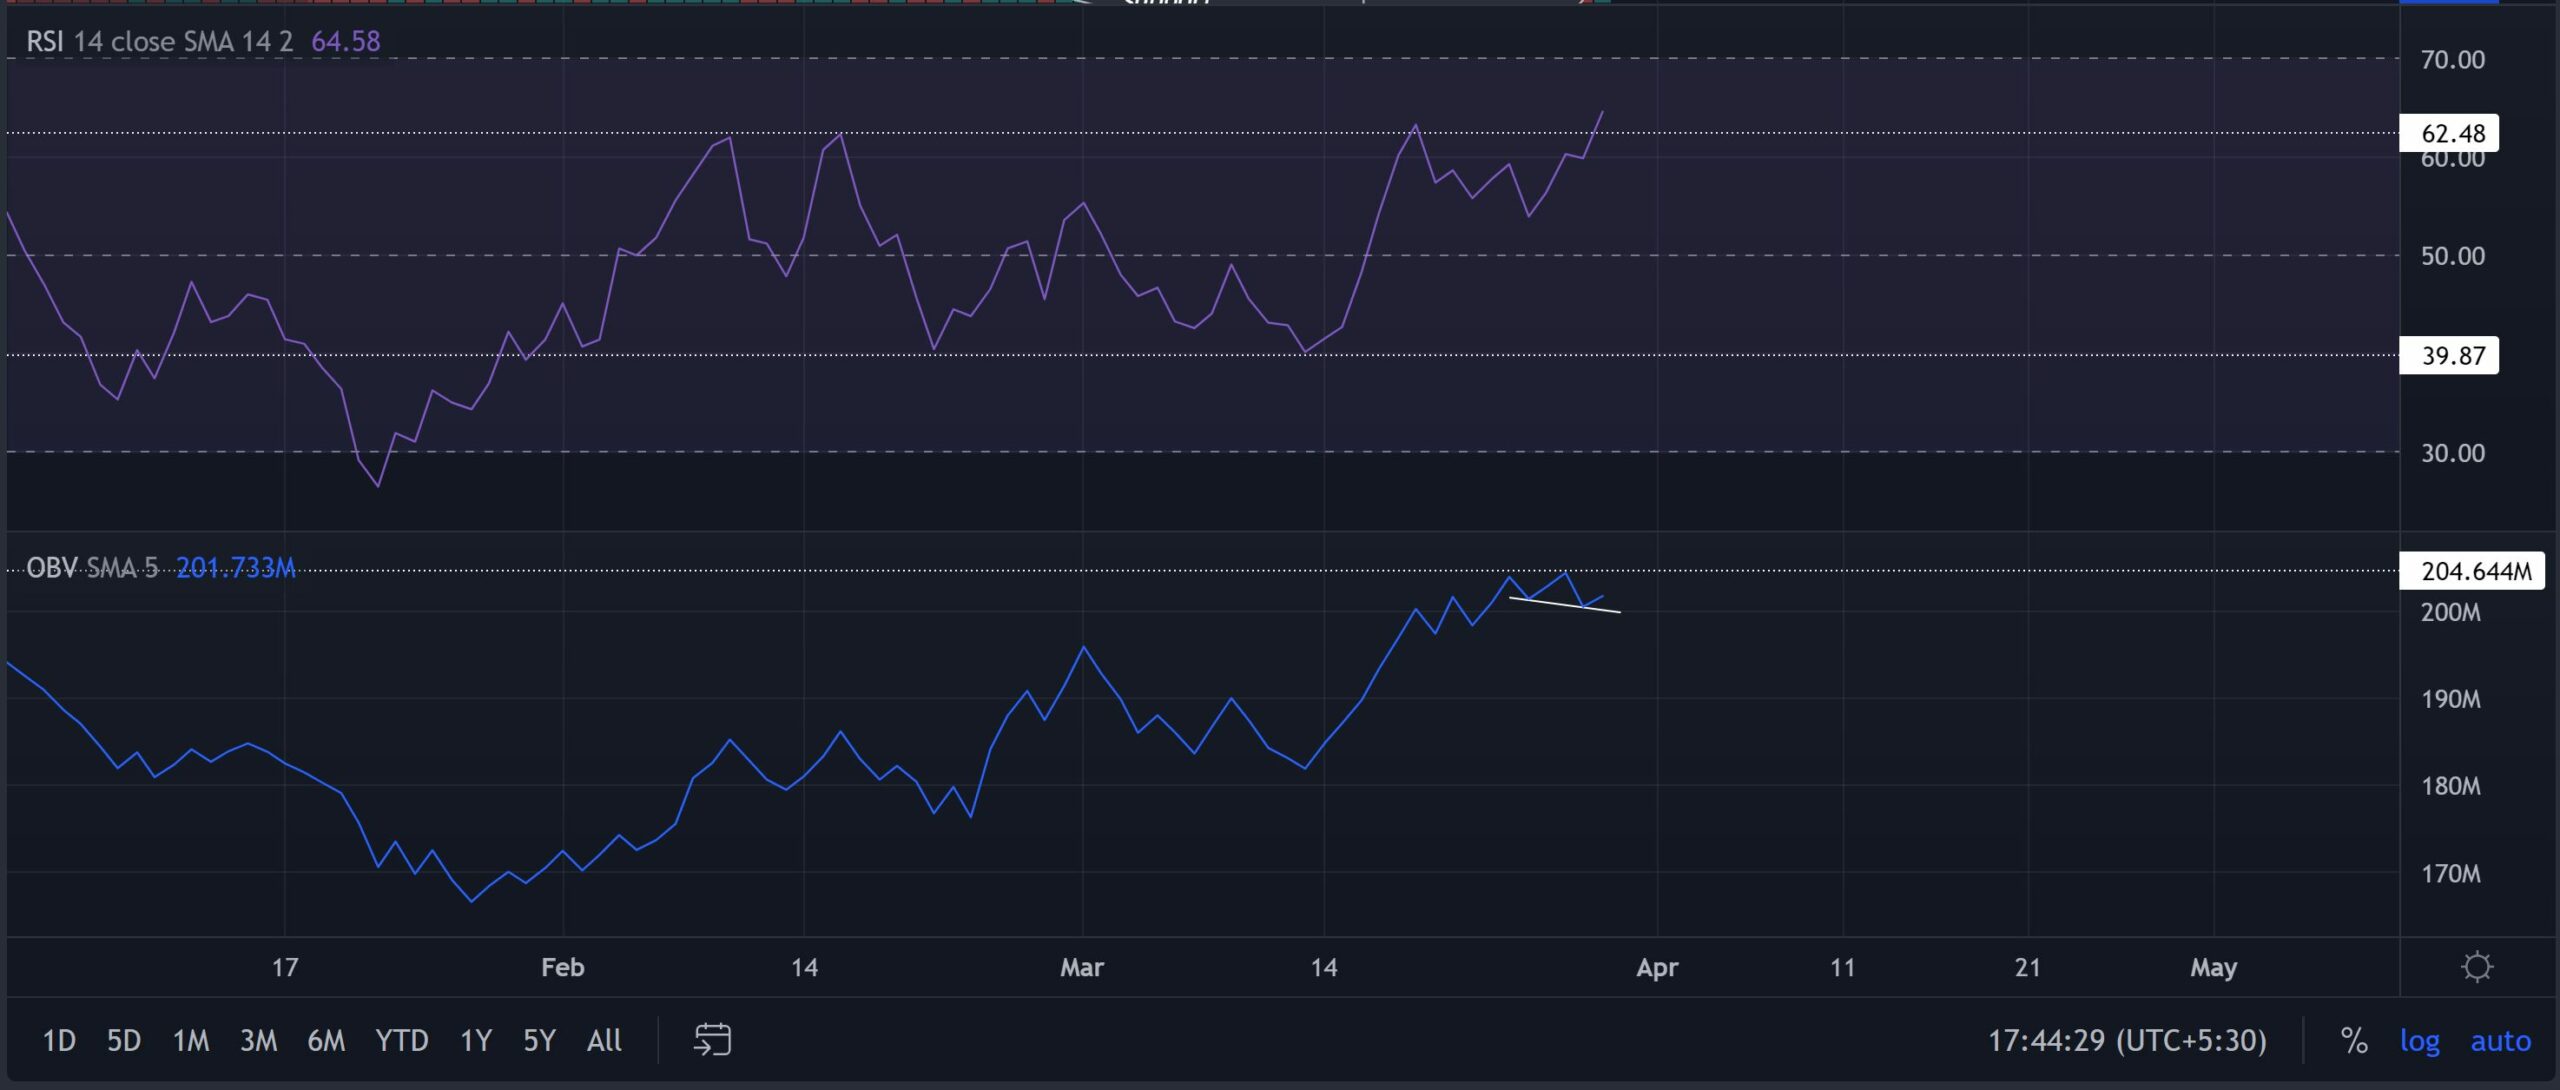
The RSI has been on a roll ever since crossing the mid-line. It revealed its bullish intentions after recently breaching the 62-mark. This trajectory opened up gates to test the overbought mark before a possible reversal. Furthermore, the OBV witnessed a bullish divergence (white) as the underlying buying pressure builds up. A likely reversal from its record high resistance could pose a setback for the bulls in the short term.
Conclusion
With the recent breach of its long-term resistance and a close above the POC, the bulls affirmed their edge. Thus, a test of the $95-$98 level before facing a short-term setback would be likely. Once the technicals approach the overbought mark, any retracements would find testing grounds near its demand zone.
Besides, the investors/traders must keep a close watch on Bitcoin’s movement. This reading could affect the overall market structure and dynamics to complement these technical factors.


