Avalanche, Polygon, Cosmos Price Analysis: 02 April
Bitcoin dropped momentarily to $44.3k but has since bounced to trade at $46.5k at press time. Avalanche, Polygon, and Cosmos showed similar bounces on their charts in the past few hours. However, even though their momentum was bullish, Polygon presented the possibility of a retracement of the recent gains.
Avalanche (AVAX)
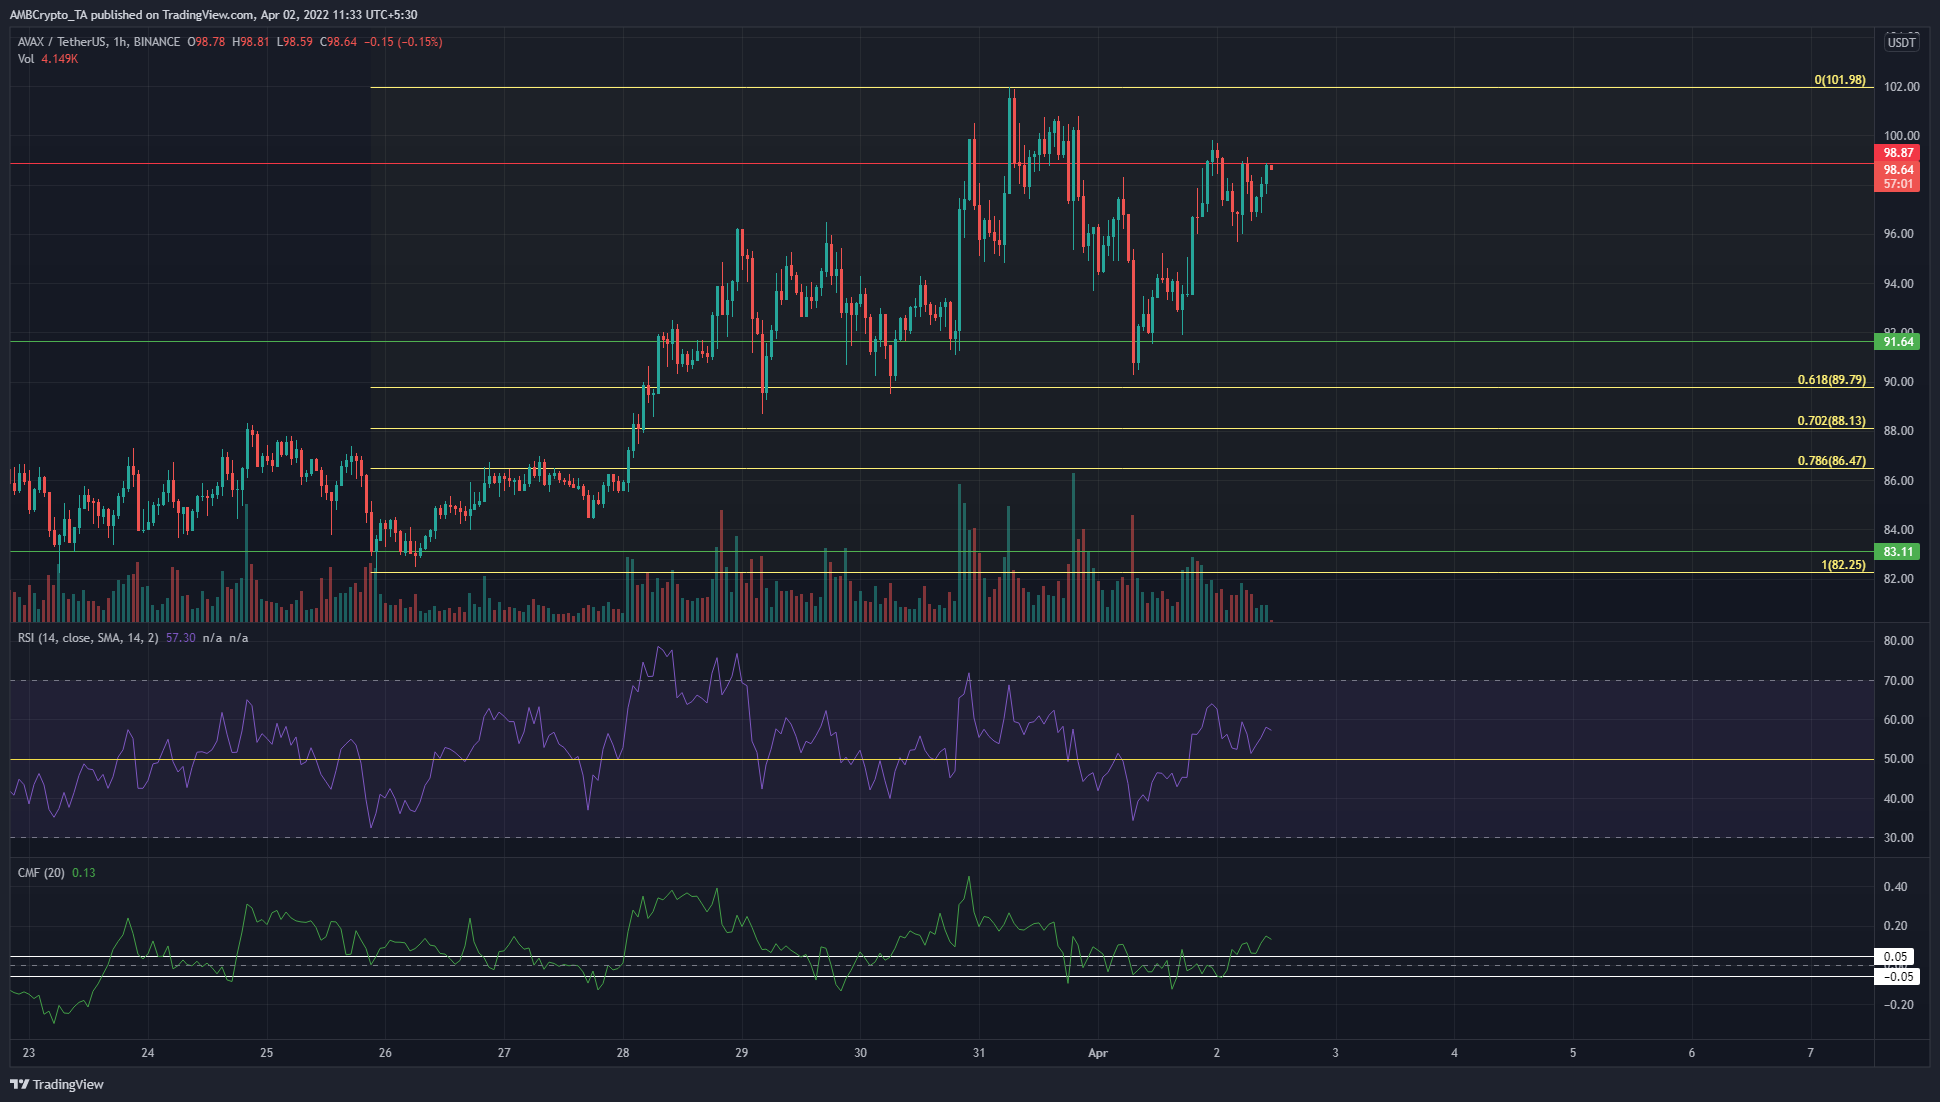
Based on the move from $82.25 to $101.98, a set of Fibonacci retracement levels was plotted. The 61.8% retracement level at $89.8, as well as the $91.6 support level right above it, had already been tested multiple times in the past few days.
At the same time, the $98-$102 area has posed stiff resistance to the price.
At the time of writing, the RSI on the hourly chart was above neutral 50 and denoted bullish momentum was present. The CMF was also above +0.05 to show buying pressure. Hence, although not a buying opportunity, it was possible that AVAX would attempt to break the $100 mark once more.
Polygon (MATIC)

MATIC has formed a range (orange) in the past week stretching from $1.57 lows to the $1.74 highs. The mid-point of this range at $1.655 has also been respected as support and resistance in the past few days.
At the time of writing, MATIC was advancing toward the range highs, which had confluence with the horizontal resistance level at $1.74. Hence, this was likely a selling opportunity. A move back toward the mid-range or range lows could play out in the days to come.
However, the RSI and the OBV showed bullish momentum and steady demand, indicative of further upside.
Cosmos (ATOM)
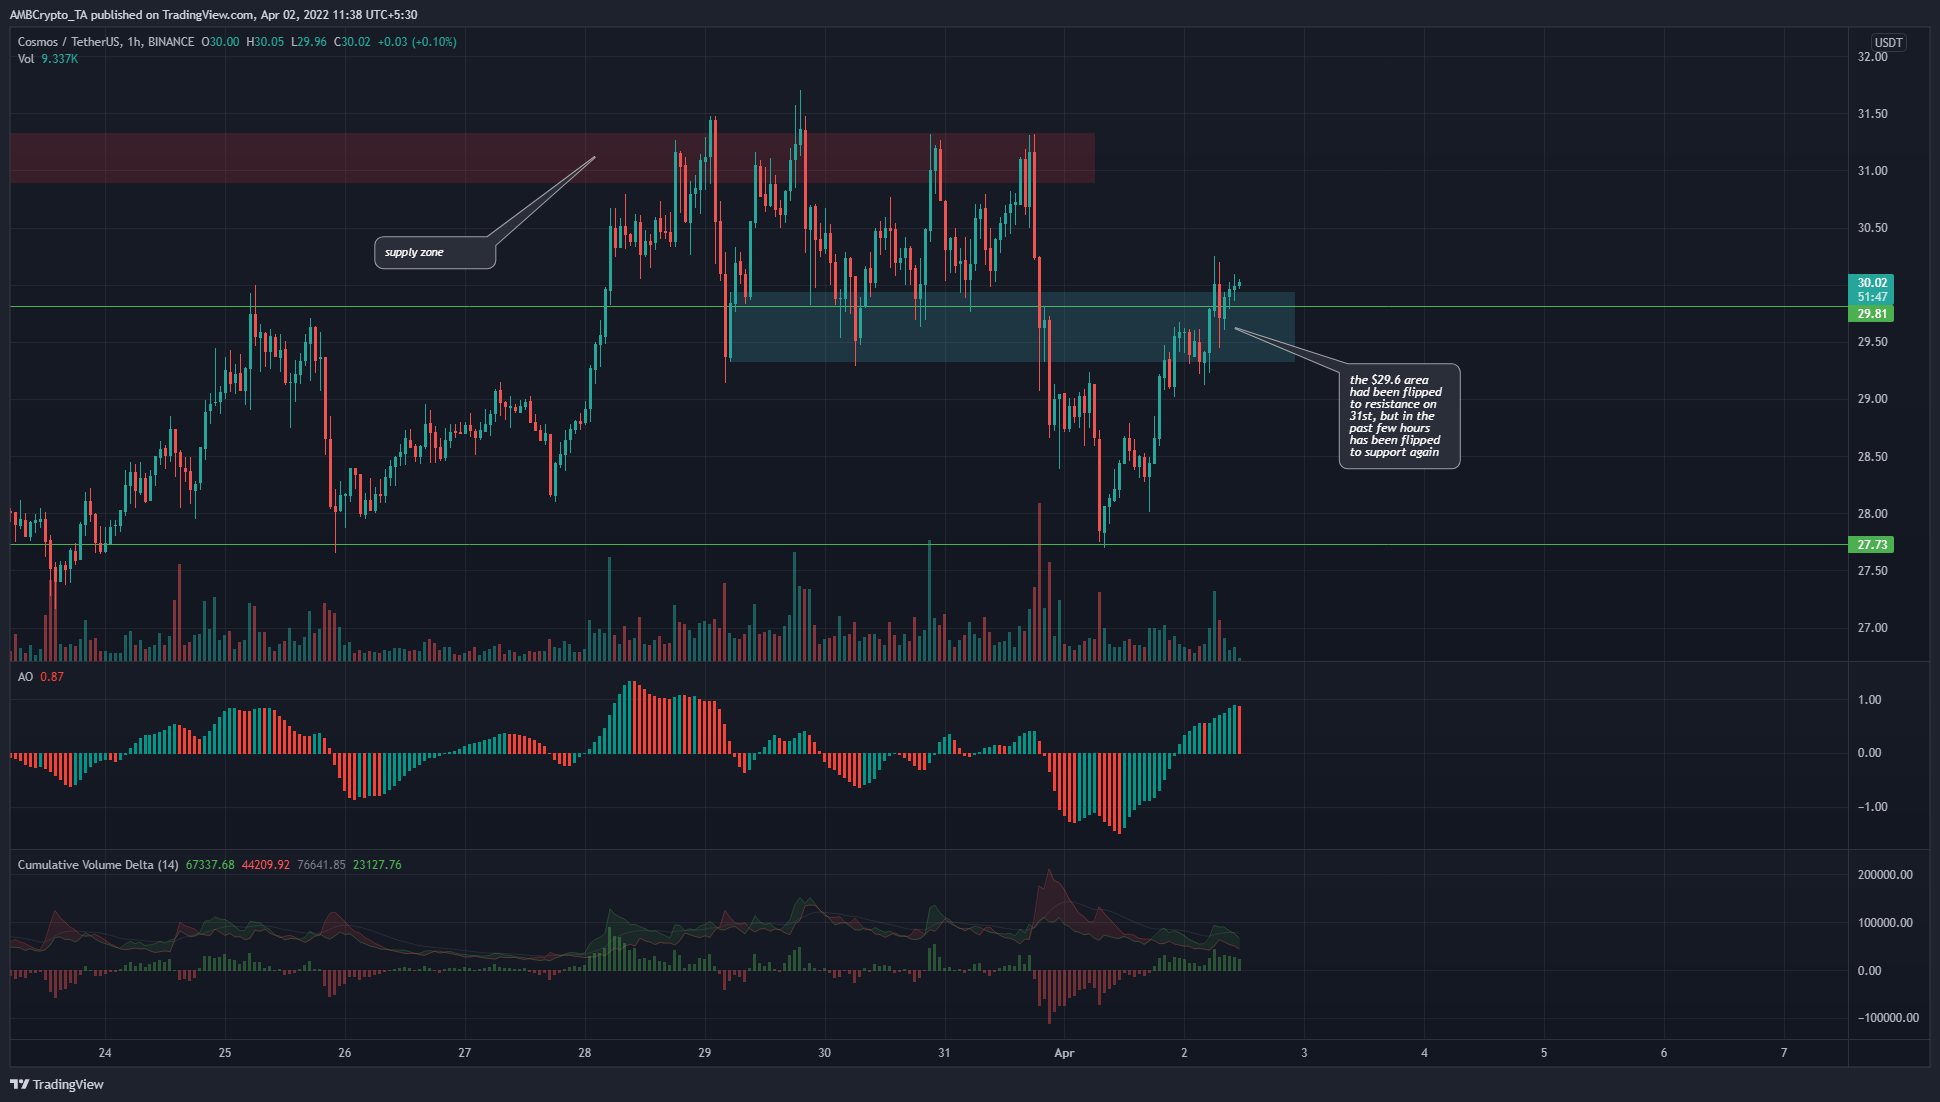
The $31 area (red box) is a strong zone of supply. The $29.81 area (cyan box) is another short-term demand zone. This zone was flipped to supply a couple of days ago, but ATOM has advanced past this level once more.
Therefore, another attempt to crack the $31 resistance could be seen in the hours to come. The Awesome Oscillator was above the zero line to reflect the bullishness following ATOM’s impulse move upward from $27.7. The CVD also showed that buying pressure was picking up.