Avalanche: Should AVAX investors continue to play the waiting game

Disclaimer: The findings of the following analysis are the sole opinions of the writer and should not be considered investment advice.
Since back-pedaling from its April highs, Avalanche (AVAX) registered a substantial spike in the selling vigor. The liquidations from the $95-zone pulled AVAX below its six-month trendline resistance (white, dashed).
The current market dynamics exhibited a visible selling edge. So, the traders/investors must be wary before pacing long bets. As AVAX approaches the apex of the short symmetrical triangle (white), a lack of buying pressure could propel a short-term setback. At press time, AVAX traded at $24.87, up by 1.61% in the last 24 hours.
AVAX Daily Chart
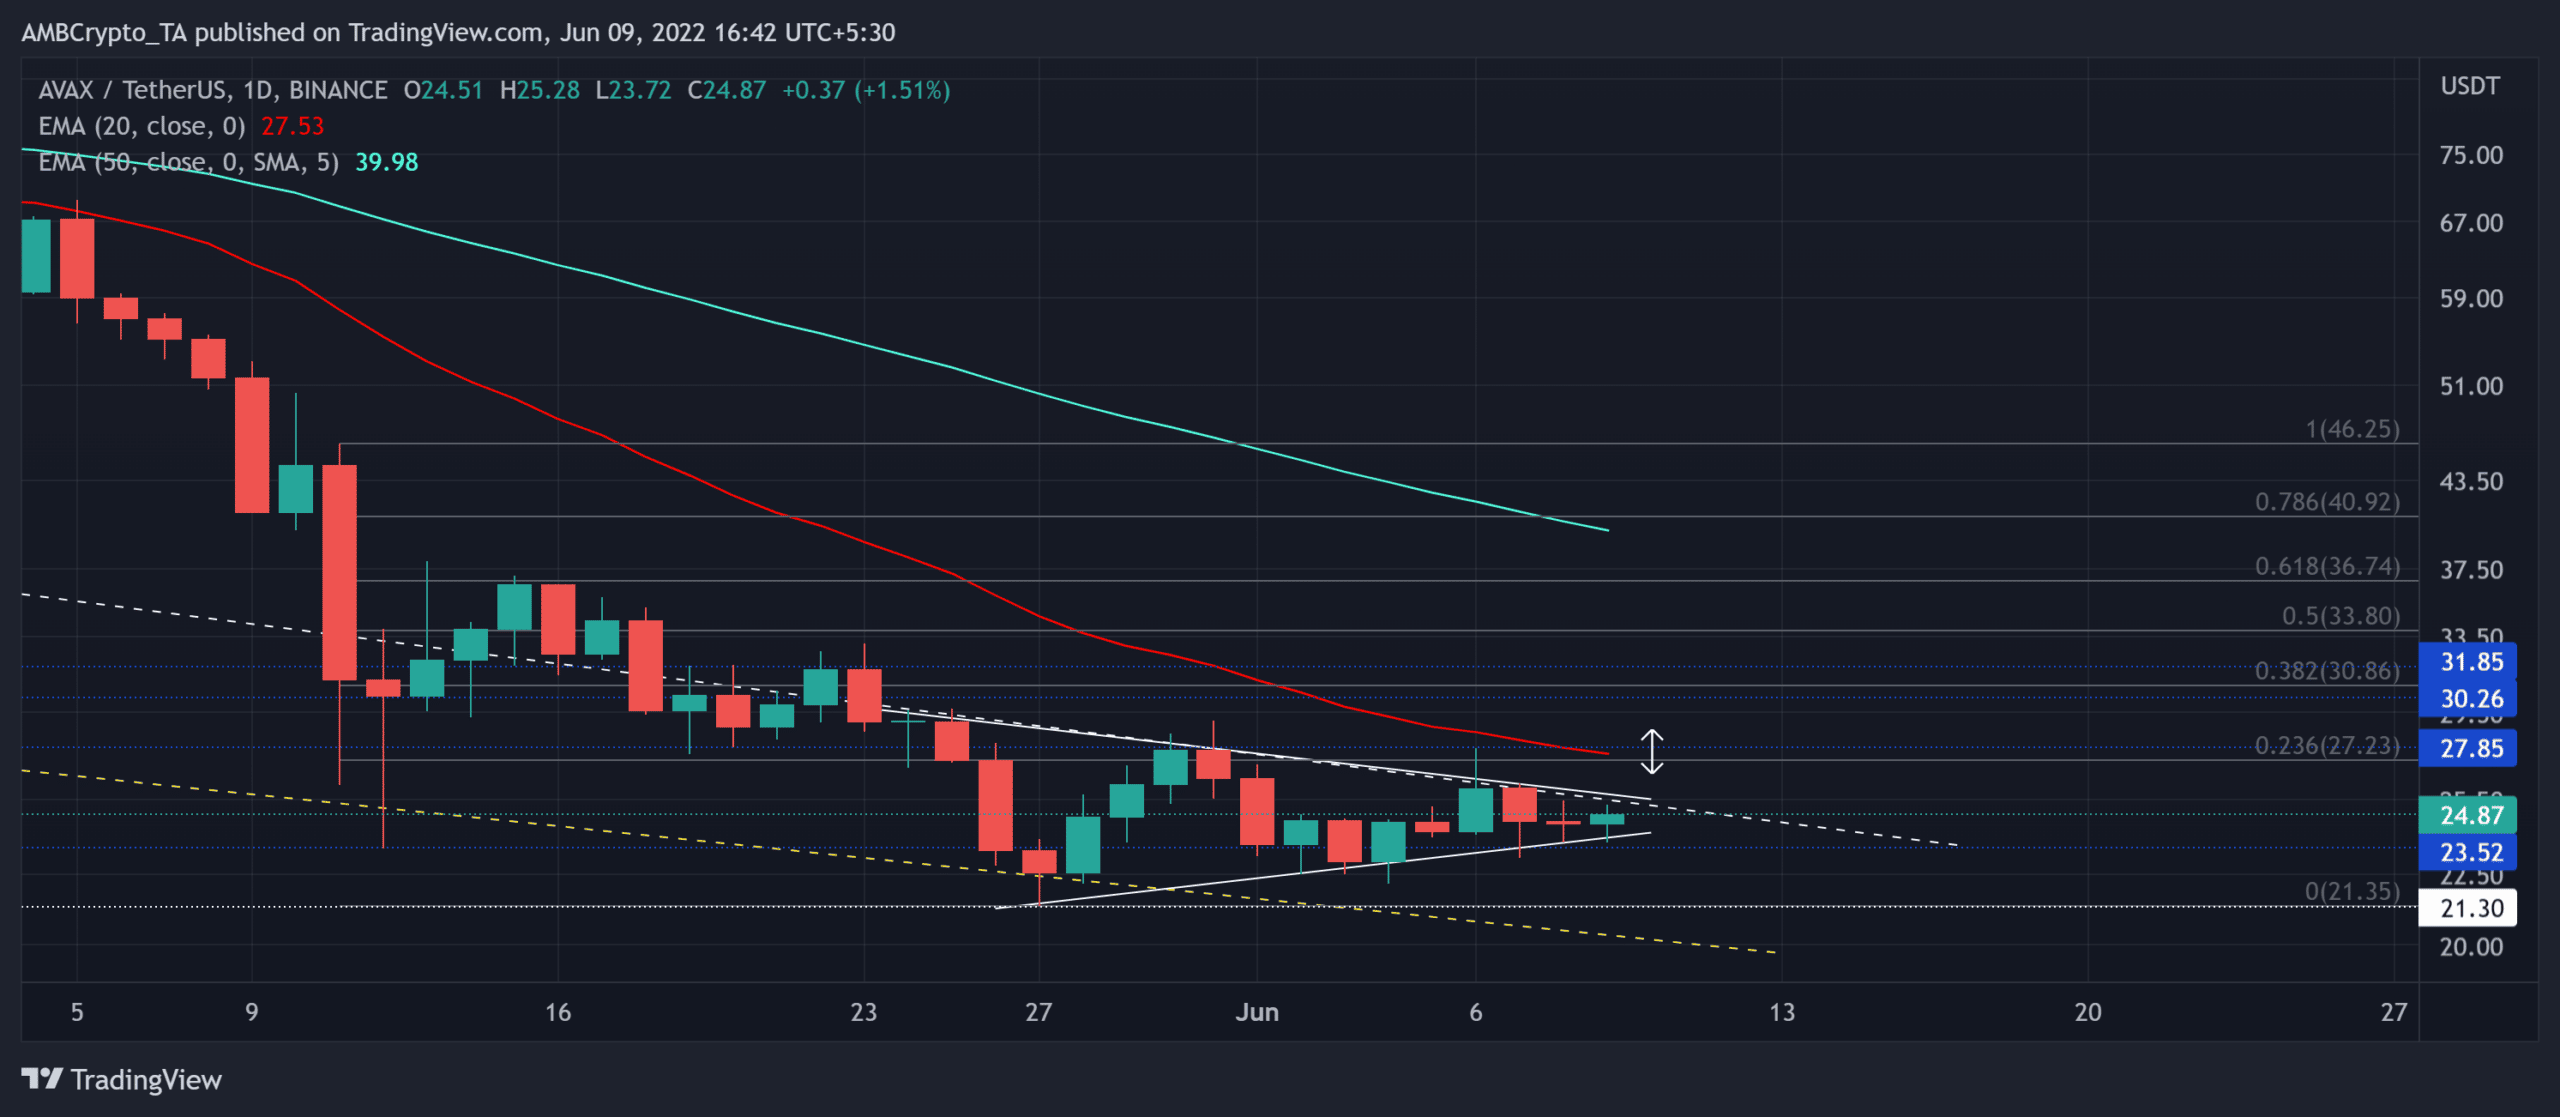
AVAX was down by more than 85% of its value as it plunged towards its nine-month low on 27 May. Then, after bouncing back from the seven-month trendline support (yellow, dashed), the altcoin chalked out a short symmetrical triangle.
The recent bearish engulfing candlesticks noted more volumes than the buy orders and thus depicted a bearish edge.
After the 20 EMA (red) jumped below the 50 EMA (cyan), the gap between them kept rising over the last few days. This reading revealed a bearish edge in the ongoing market structure. Any close below the pattern and the $23-support could expose AVAX to a 10% downside in the $20-$21 range.
However, such an over-extended gap between the 20/50 EMA has historically provoked buying comebacks. For this, the buyers still needed to find a close above the six-month trendline resistance and the 20 EMA.
Rationale

The Relative Strength Index has been struggling to break above the 39-mark for over a month now. Its current readings blended well with the bearish outlook.
Although Aroon up (yellow) undertook a northbound trajectory, investors/traders must look for a close above the 70%-mark before placing long bets. Finally, the bullish divergence on the OBV can extend the squeeze in the current zone.
Conclusion
Should the bears capitalize on the current sentiment, a close below the pattern would open doorways for a $20-$21 range retest. The buyers still need to propel an uptick in buying volumes to invalidate the likely bearish outcomes.
At last, the investors/traders must keep a close watch on Bitcoin’s movement. This reading would be vital to complement these technical factors.