Axie Infinity [AXS] slipped beneath $43, here are the next targets

Disclaimer: The findings of the following analysis are the sole opinions of the writer and should not be considered investment advice
In March, Axie Infinity tokens were trading at $45, which was also a long-term support level for the price on the charts. As the month of March progressed, the bulls were able to initiate a rally and drive prices as high as $74.85. This saw a pullback to $62, before another rally to $75.55 which had less conviction. In April, Axie Infinity has been in a downtrend as the prices dropped below $60 once more.
AXS- 1 Day Chart
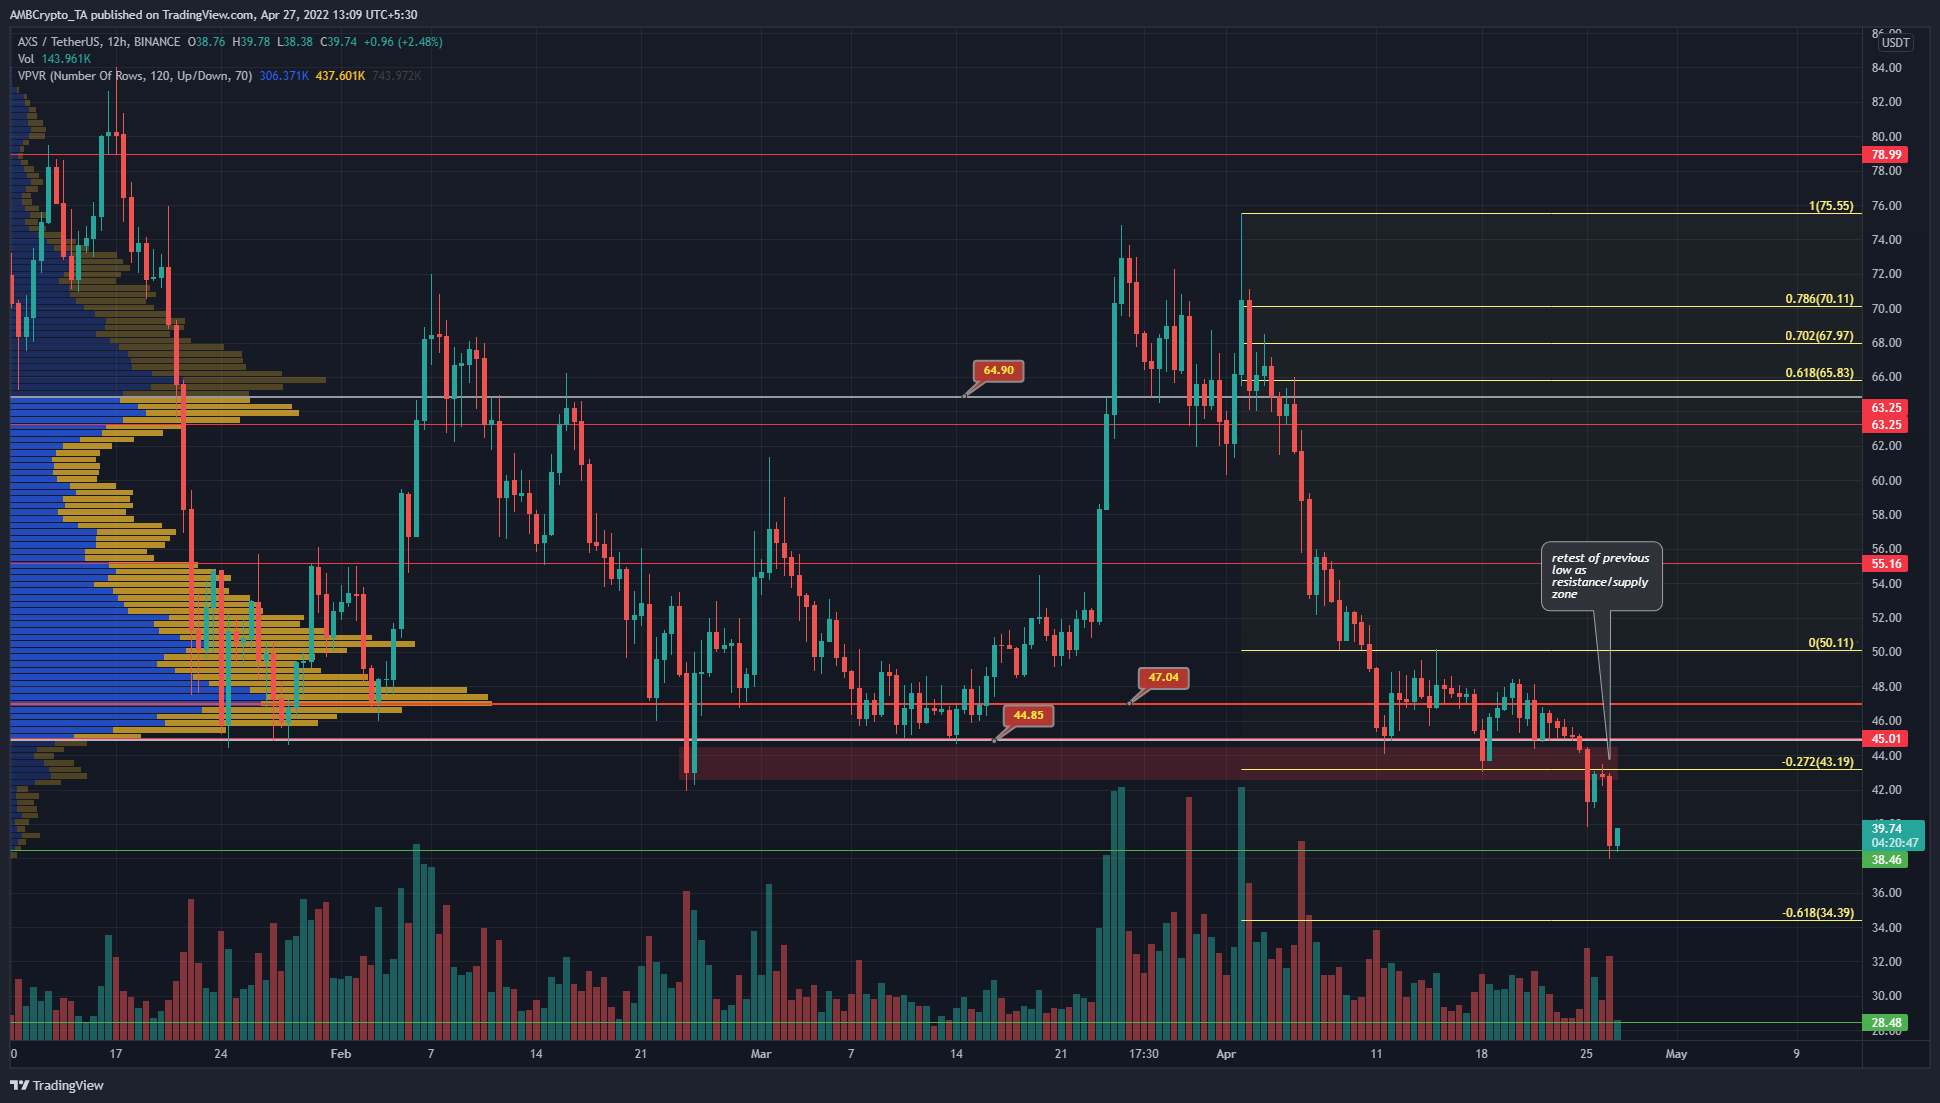
After the rally in March, prices slumped back beneath the $60 level and flipped the market structure from bullish to bearish. Once this bias had been flipped, the bearish momentum snowballed in early April to push AXS beneath the $55 and $50 levels.
Based on this move from $75.55 to $50.1, a set of Fibonacci retracement and extension levels was plotted. They showed the 27.2% and 61.8% extension levels to lie at $43.19 and $34.39, which meant these are lows that AXS was likely to plumb in the weeks to come.
The Volume Profile Visible Range also highlighted the Value Area Lows and Highs to lie at $44.85 and $64.9 respectively, going back to mid-January. The Point of Control lies at $47, and AXS was trading at $39.74 and climbing at press time after meeting some support at $38.46.
Rationale
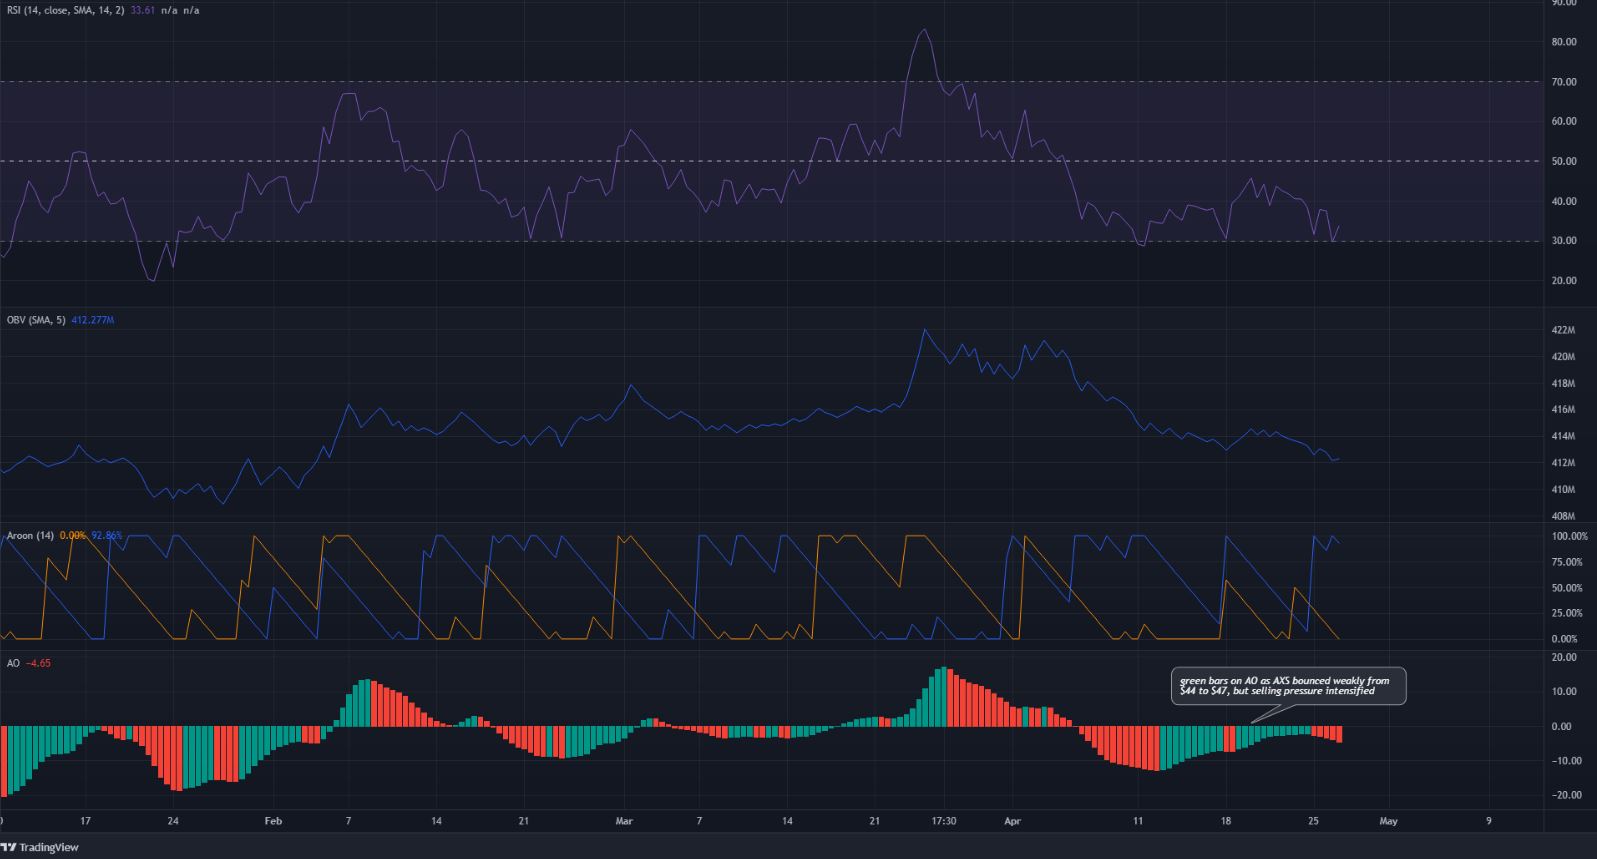
The RSI has been beneath neutral 50 for nearly three weeks now. However, it did not yet show a divergence to warrant a bounce. In the days to come, a hidden bearish divergence on the RSI might appear.
This is when the price makes a lower high but the RSI pushes to a higher high, and this could mark a local top on lower timeframes for AXS before continued downside toward $34.4.
The OBV has also been in a steady downtrend to highlight how selling pressure has been significant recently and agreed with the price action. The Aroon Indicator also had the Aroon Down (blue) dominant on its chart for most of April.
The Awesome Oscillator continued to remain below the zero line and indicated weakening bearish momentum a few days ago as AXS bounced from $44 to $47. However, it shifted to a sell signal once more the previous day.
Conclusion
The indicators above supported a bearish outlook for the price, and the Fibonacci extension levels gave a technical target of $34.39. Hence, it remains possible that further selling pressure could drive AXS as low as $35.


