AXS’s rally is behind it, but here’s what is ahead of it

Disclaimer: The findings of the following analysis are the sole opinions of the writer and should not be considered investment advice
As anticipated by a previous article, Axie Infinity (AXS) continued its uptrend after reviving from its demand zone. In doing so, it pictured a morning star candlestick pattern.
If the current slump from the golden Fibonacci level continues, AXS could find support in the $60-$62 range. If the 20 EMA (red) crosses above the 50 EMA (cyan), the alt will possibly position itself for a retest of the 61.8% level in the coming days.
At press time, AXS was trading at $65.92, down by 2.03% in the last 24 hours.
AXS Daily Chart
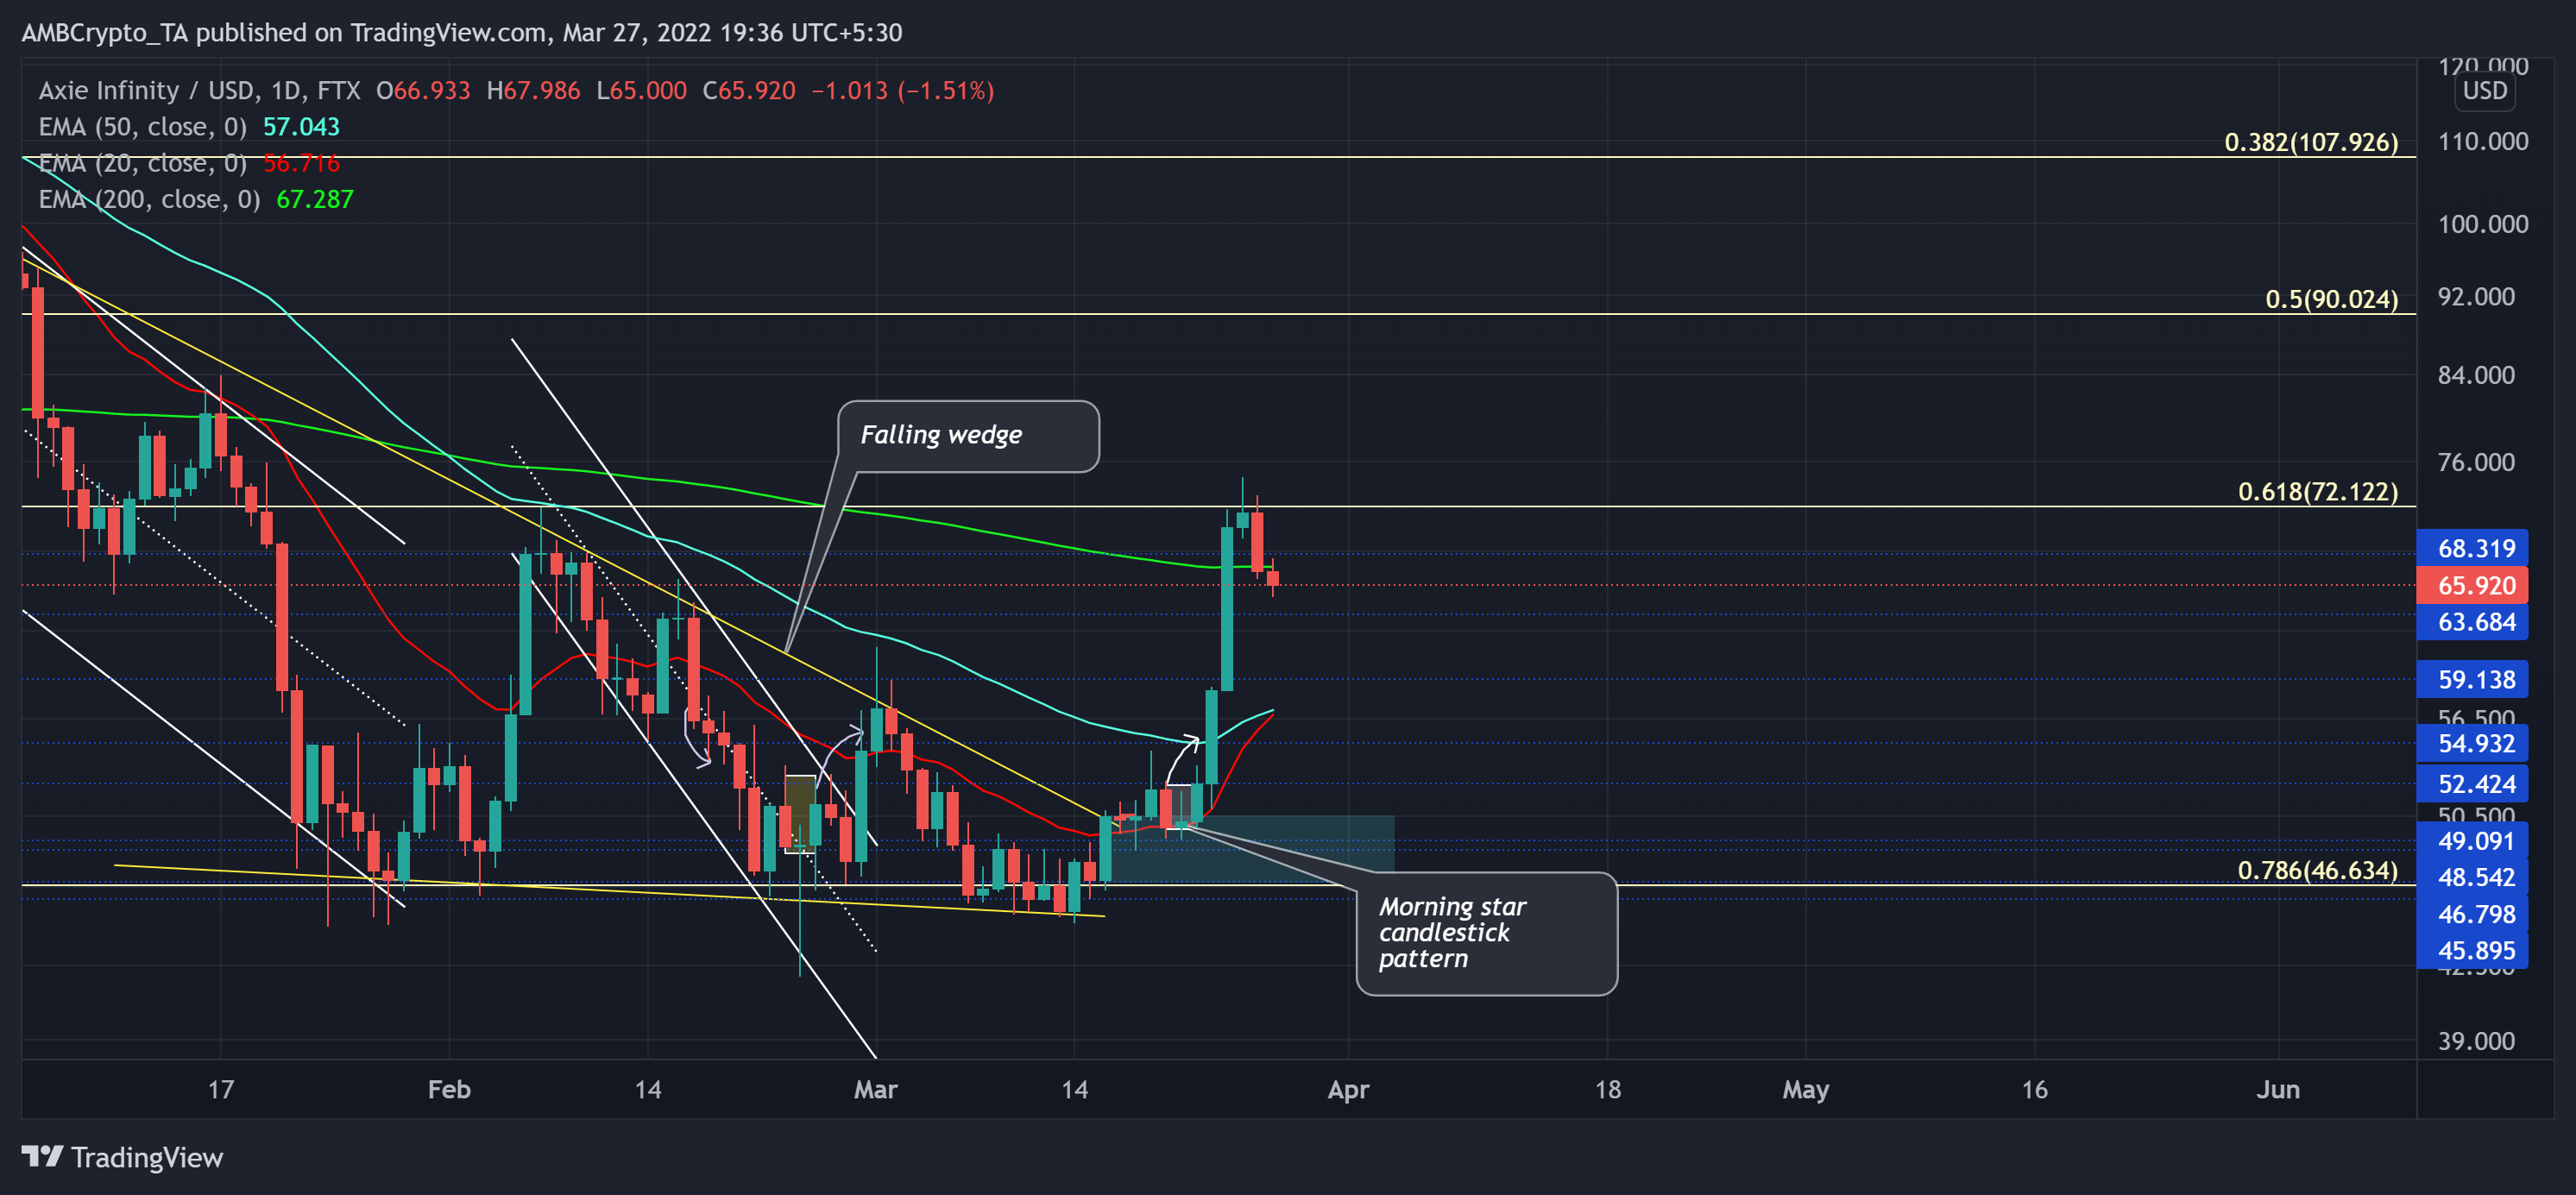
The descent from its ATH marked multiple down channels (white) and a falling wedge on its daily chart as the alt lost nearly 74.4% of its value.
Although it lost the critical 61.8% Fibonacci support, the bulls upheld the 78.6% support intact. Thus, AXS saw a falling wedge breakout on its daily chart over the past week. The altcoin registered an over 65% ROI between 14-25 March. The same was halted at the 61.8% level.
As the buyers countered the prevalent selling vigor, the gap between the 20 EMA (red) and 50 EMA (cyan) significantly decreased. Now, a sustained downfall could find a floor in the $63-zone. Any failure of the bulls to defend this mark could see a fallout towards its 20 EMA. Following this, the bulls would likely continue their rally in their quest to snap the $72-level.
Rationale
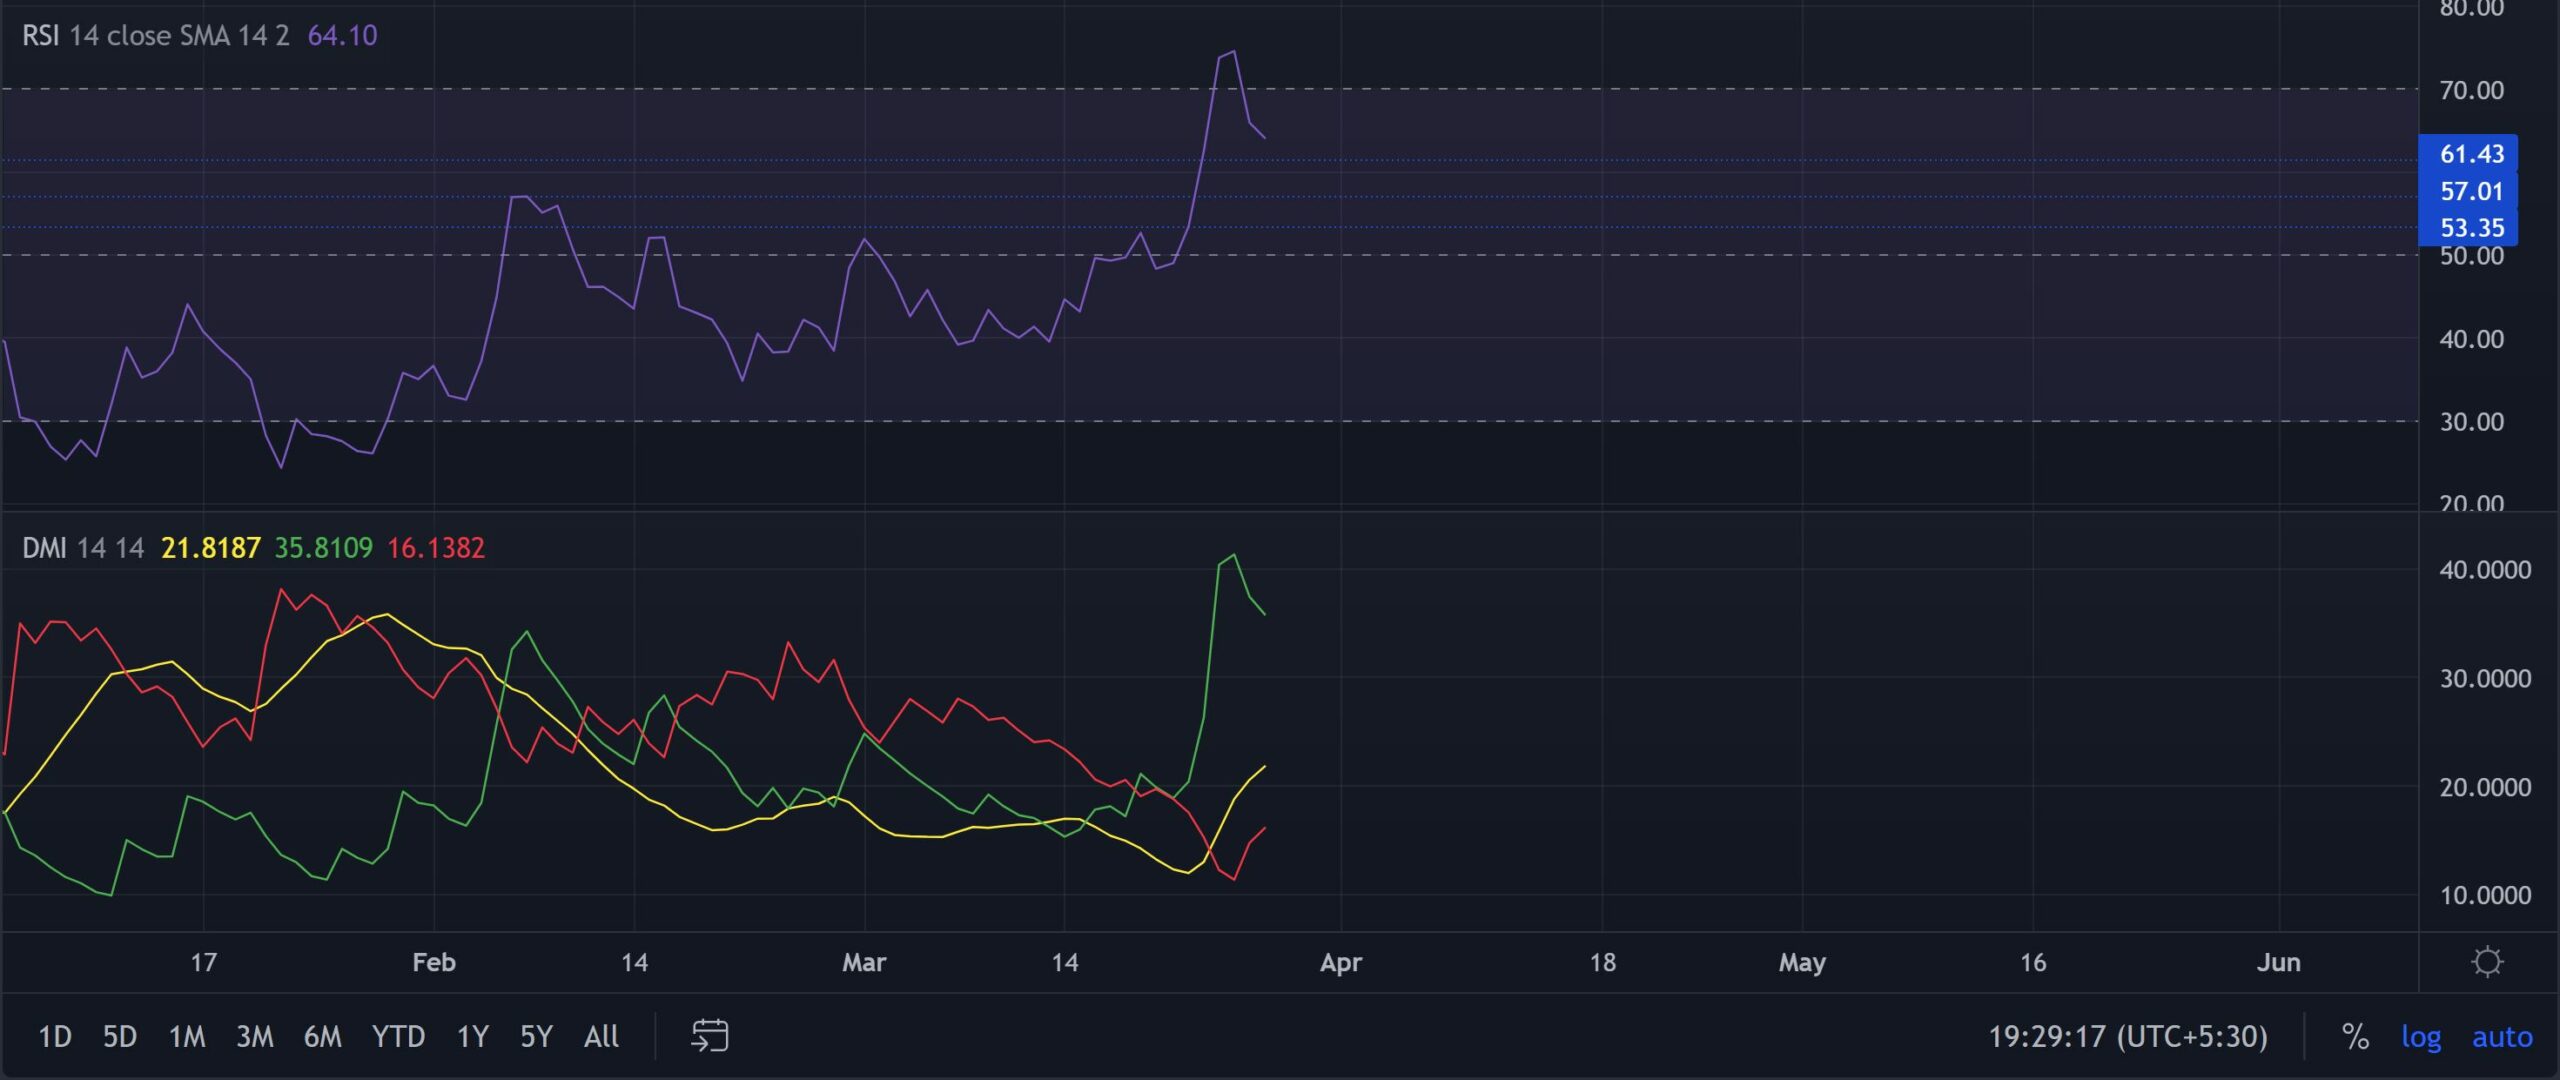
The RSI saw an expected reversal from the overbought territory. It eyed a test of the 57-mark before making a trend-commital move. Its recent movements affirmed the momentum in favor of buyers.
Furthermore, thanks to the overstretched gap between the +DI and the -DI, the bulls visibly assumed the near-term control. A potential correction from this point should not surprise investors/traders.
Conclusion
The $63-mark would be critical for the bulls to defend a further fallout towards the $60-$62 range. Also, while the 20 EMA endeavours to close above the 50 EMA, the bulls should aim to test the $72-mark in the days to come.
To top it up, the altcoin shares an 83% 30-day correlation with Bitcoin. Thus, keeping an eye on Bitcoin’s movement would be essential towards making a profitable move.


