Axie Infinity [AXS]: Assessing the true potential of altcoin’s uptrend

Disclaimer: The findings of the following analysis are the sole opinions of the writer and should not be considered investment advice
Since its ATH on 6 November, Axie Infinity (AXS) has steeply fallen towards its long-term $46-floor, one that coincided with the 78.6% Fibonacci level.
Soon after the falling wedge breakout, bulls faced some resistance at the $52-mark. Also, it recently saw a push above its long-term liquidity range (Point of Control/POC). Considering the sturdiness of the 78.6% Fibonacci support, AXS intends to continue its uptrend before a retest of its POC in the coming days.
At press time, AXS was trading at $52.466, up by 1.09% in the last 24 hours.
AXS Daily Chart
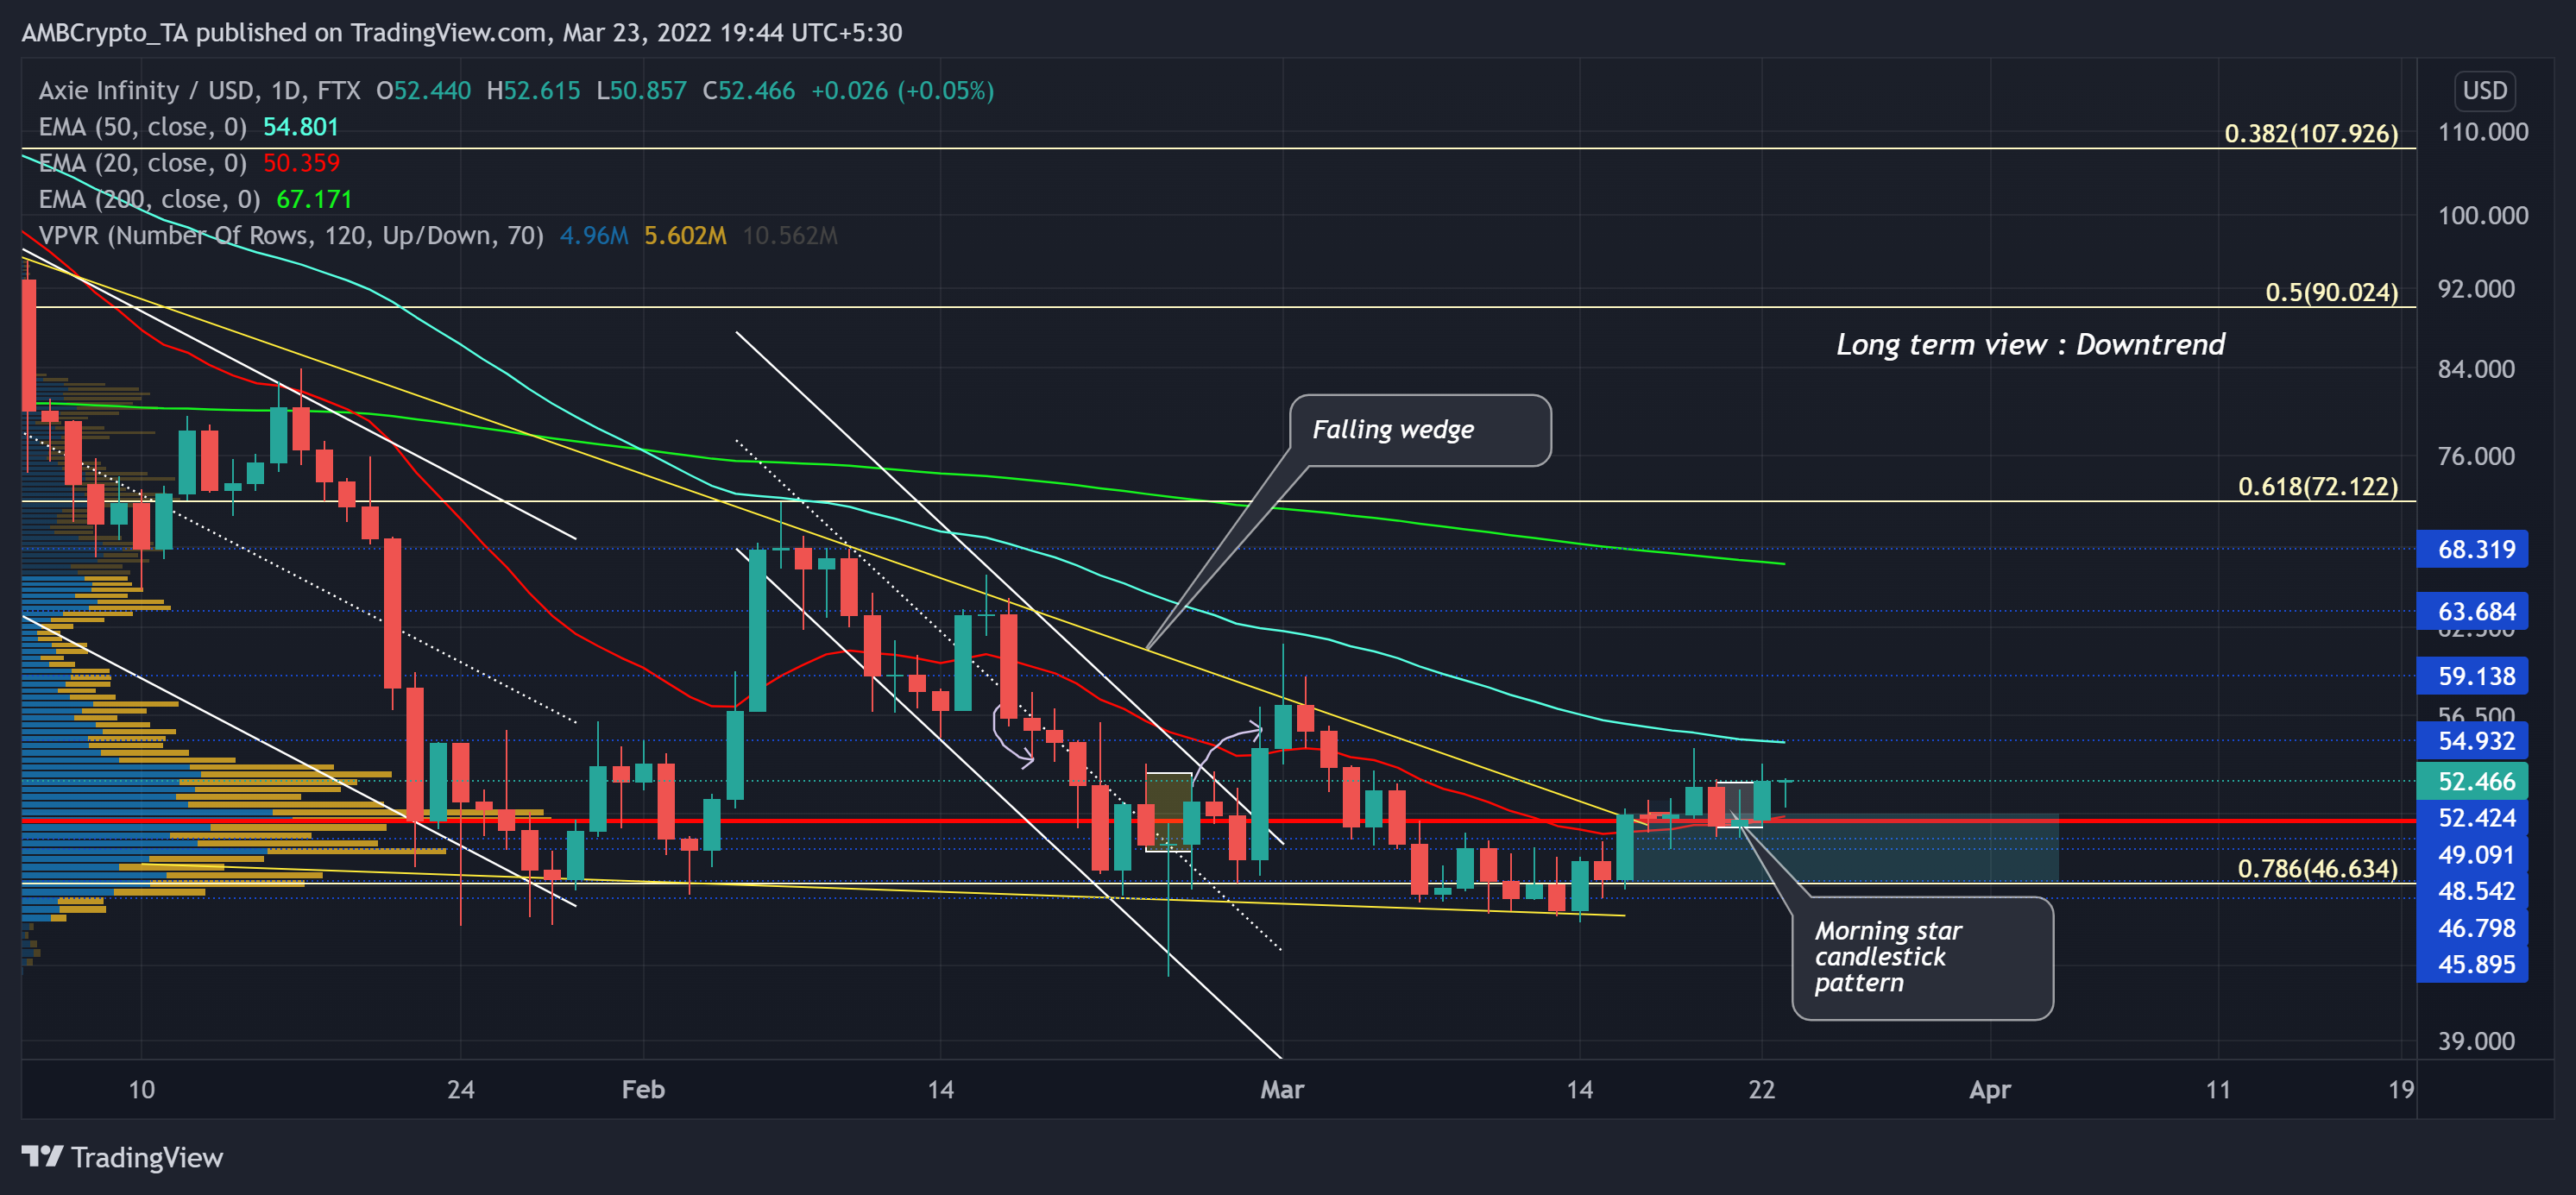
The retracement phase marked two down channels (white) on its daily chart as the alt lost nearly 74.4% of its value after its ATH. Consequently, AXS touched its six-month low on 24 February. Following this, it hovered near its POC.
Although it lost the critical 61.8% Fibonacci support, the bulls were keen on keeping the 78.6% level intact. As a result, the alt saw a falling wedge breakout on its daily chart over the past week. As the buyers attempted to counter the prevalent selling spree, the distance between the 20 EMA (red) and 50 EMA (cyan) decreased.
Now, with the bulls managing to close above the POC, AXS’s chart pictured a morning star candlestick pattern. Thus, improving the chances of a sustained uptrend from its immediate demand zone in the $46 to $50-zone.
Rationale
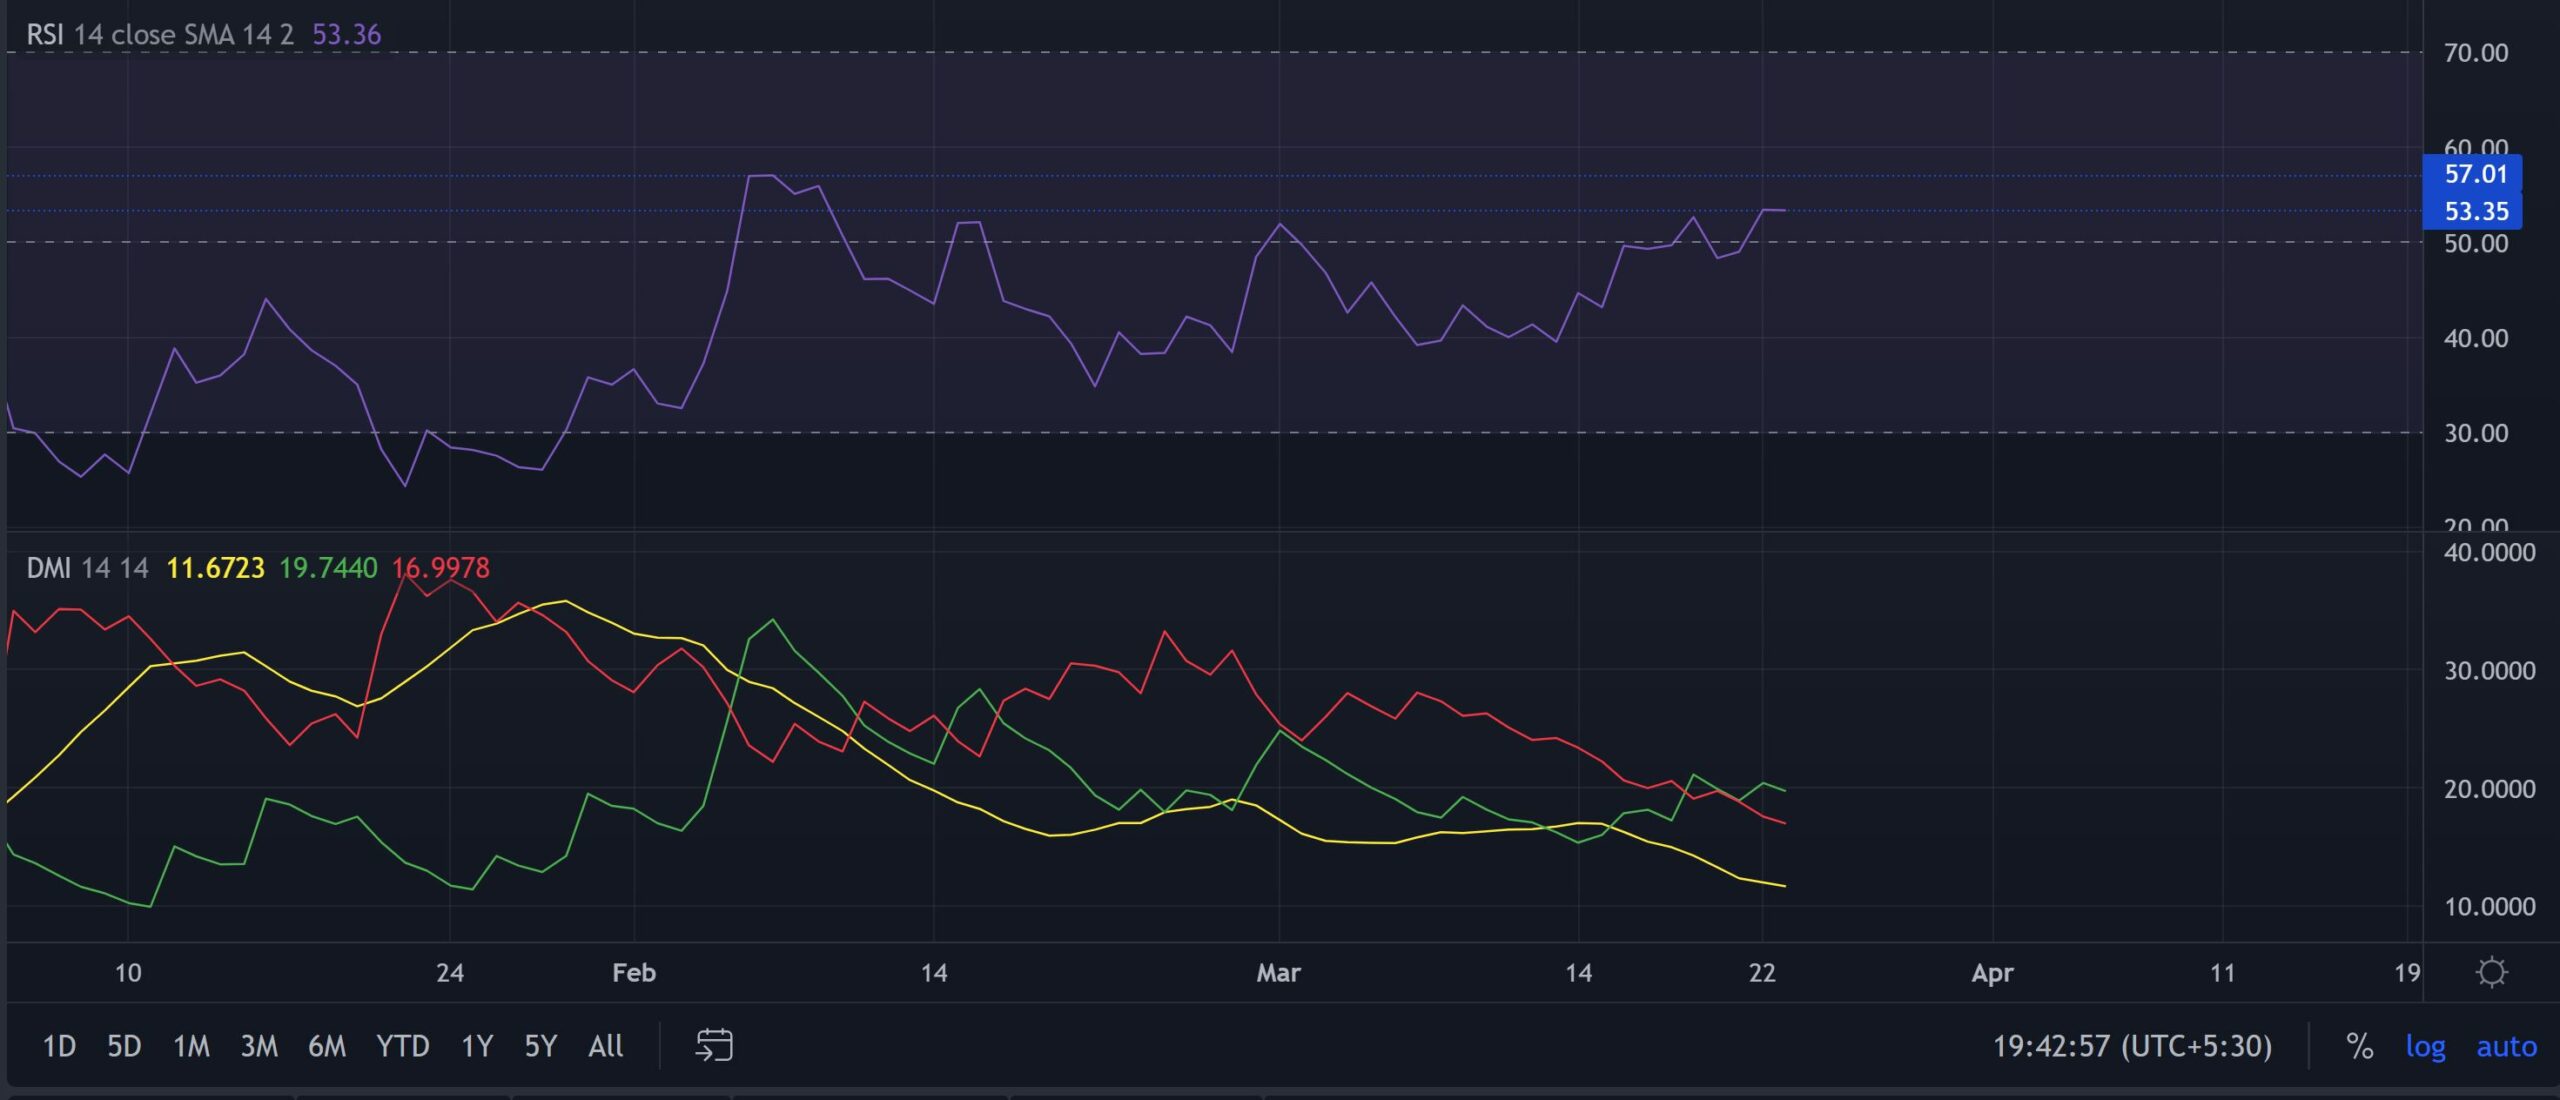
The RSI finally managed to maintain its recovery towards the 53-mark resistance. While it confirmed momentum in favor of the bulls, they will try to snap the 57-mark. The buyers still need to ensure the midline as immediate support for any retracements.
Furthermore, the DMI continued to flash a bullish preference. Alas, the ADX revealed a substantially weak directional trend for AXS.
Conclusion
Considering the historical tendencies of the alt to bounce back from the 78.6% level along with the morning star candlestick pattern, AXS could continue its uptrend. But with a weak trend, a potential re-test of the $49-zone should not surprise investors/traders.
Moreover, the alt shares an 80% 30-day correlation with Bitcoin. Thus, keeping an eye on Bitcoin’s movement would be essential towards making a profitable move.


