BCH: Why despite flipping a resistance, it remains tough to buy into

Disclaimer: The findings of the following analysis are the sole opinions of the writer and should not be considered investment advice
Bitcoin Cash has been in a steady downtrend since November last year, but in the past week, the coin showed some evidence that this trend could be broken, or at the very least stalled. There were two ranges of importance for Bitcoin Cash on the longer timeframes. Buyers, especially risk-averse ones, can consider staying away from Bitcoin Cash until the $400 level is flipped to a support zone. Then again, such a move could turn out to be just a liquidity grab before new lows.
BCH- 1D

The orange levels depict a range from $400 to $720, a range that BCH has traded between since early January to late December. In mid-January this year, the price established a new range (white) from $272 to $345.
BCH has broken out of this range in the past few days, and it has had some bullish momentum in the past two weeks. Another thing to note was that BCH has registered a series of lower highs since November, and this has been broken in the past few days.
While this was an encouraging development for the bulls, there was a long way to go yet to establish an uptrend. The $400 area will likely be a strong resistance zone, as it was the former range’s lows.
Rationale
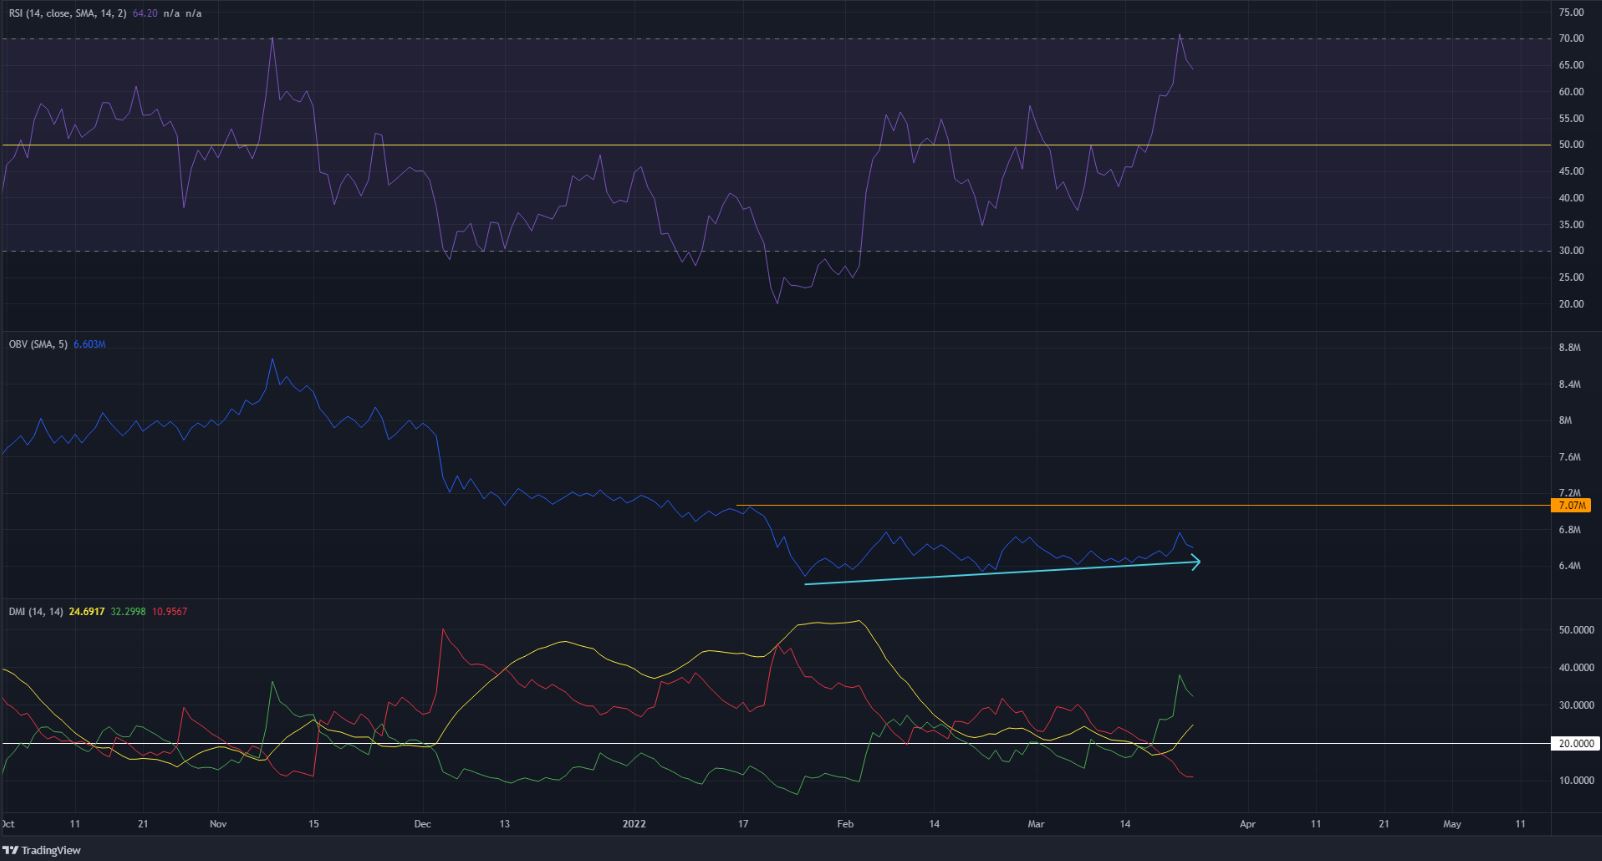
Due to the buy demand in the past week, the prices have been climbing and this was reflected on the momentum indicator. The RSI climbed to 70 and was currently sitting at 64.2. The OBV has also formed a series of higher lows in the past two months. However, this wasn’t indicative of a change in trend yet.
The Directional Movement Index showed that a strong uptrend was in progress, with both the ADX (yellow) and the +DI (green) well above the 20 mark.
Conclusion
The conclusion drawn from both the indicators and the price action is that, while there has been a breakout from a range of three months, heavy resistance still remained to the upside. Bitcoin Cash is quite closely related to how Bitcoin itself moves on the chart, and Bitcoin has resistance in the $46k-$48k area. Therefore, for Bitcoin Cash, the $360-$400 area is an area to watch out for.


