Binance Coin, Dogecoin, Tron Price Analysis: 08 June

Binance Coin’s ascending triangle was negated once the price breached past the bottom trendline of the pattern. Dogecoin’s movement was hardly a surprise as the formation of a descending triangle inclined towards a bearish outcome. Finally, a rise in volatility could heighten losses for Tron over the coming sessions.
Binance Coin [BNB]

Source: BNB/USD, TradingView
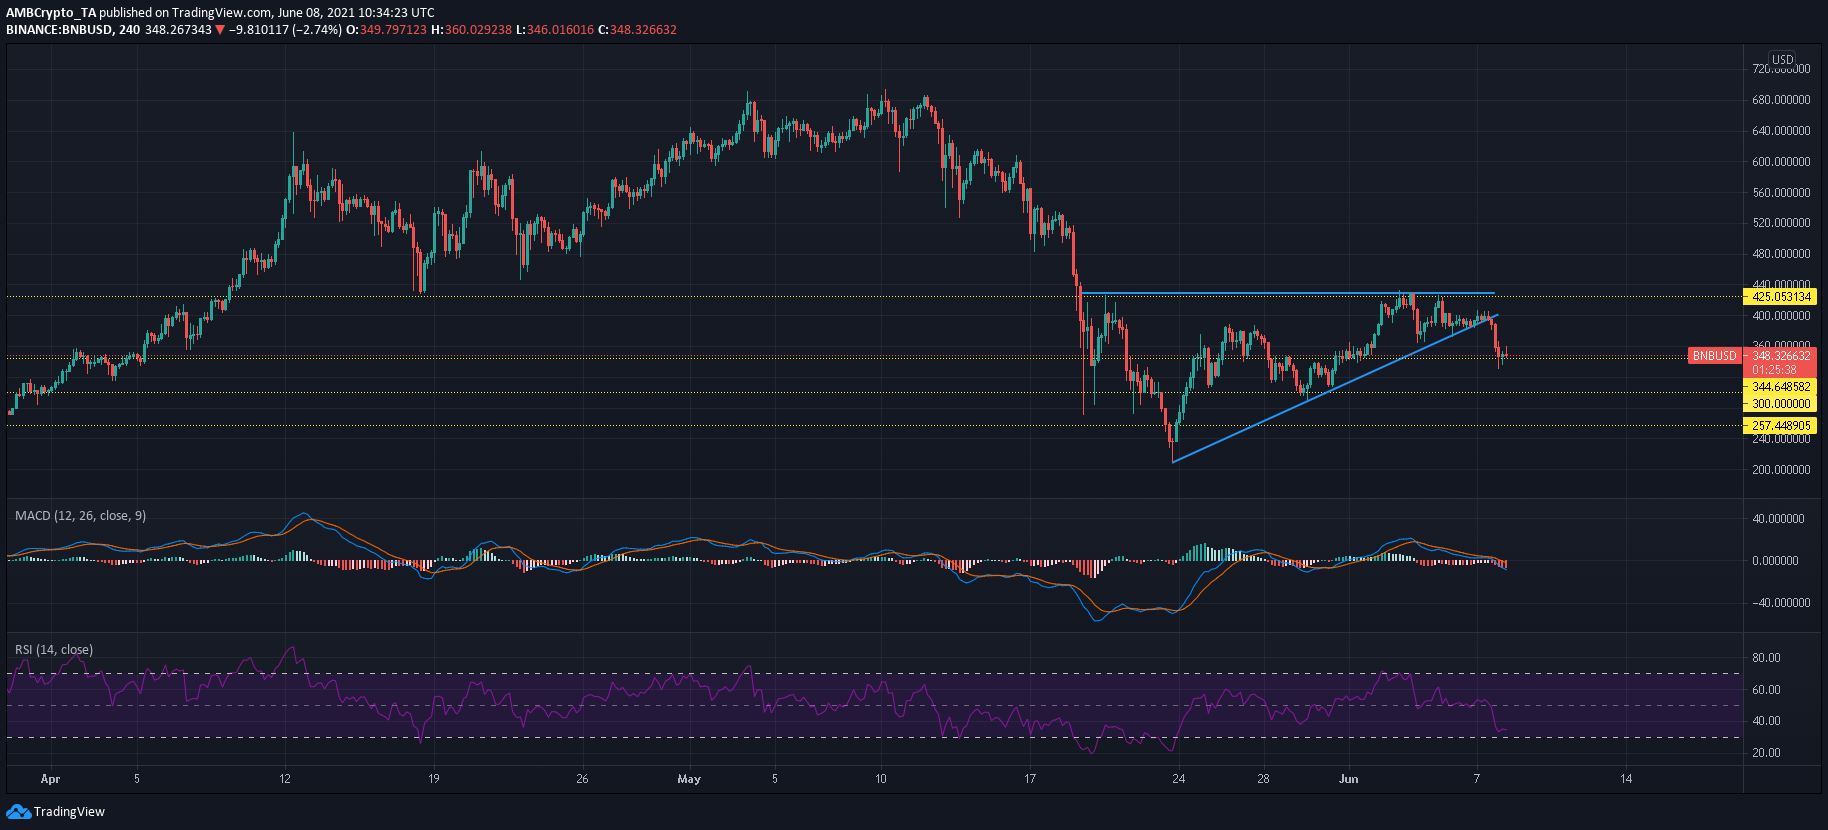
Binance Coin’s ascending triangle got invalidated once the candlesticks pierced the bottom trendline of the pattern. Losses amounted to 13% from the lower trendline to a support region around $350. Some buying was noted over the past few sessions on the 4-hour chart but the threat of another breakdown was on the cards.
RSI fell sharply towards bearish territory as sellers dominated the market. Bearish crossover was also seen on MACD, while the histogram showed rising momentum. An extended sell-off could see BNB drop towards $300-support. Any move lower than that likely would be countered at a demand zone between $210-$235.
Dogecoin [DOGE]

Source: DOGE/USD, TradingView
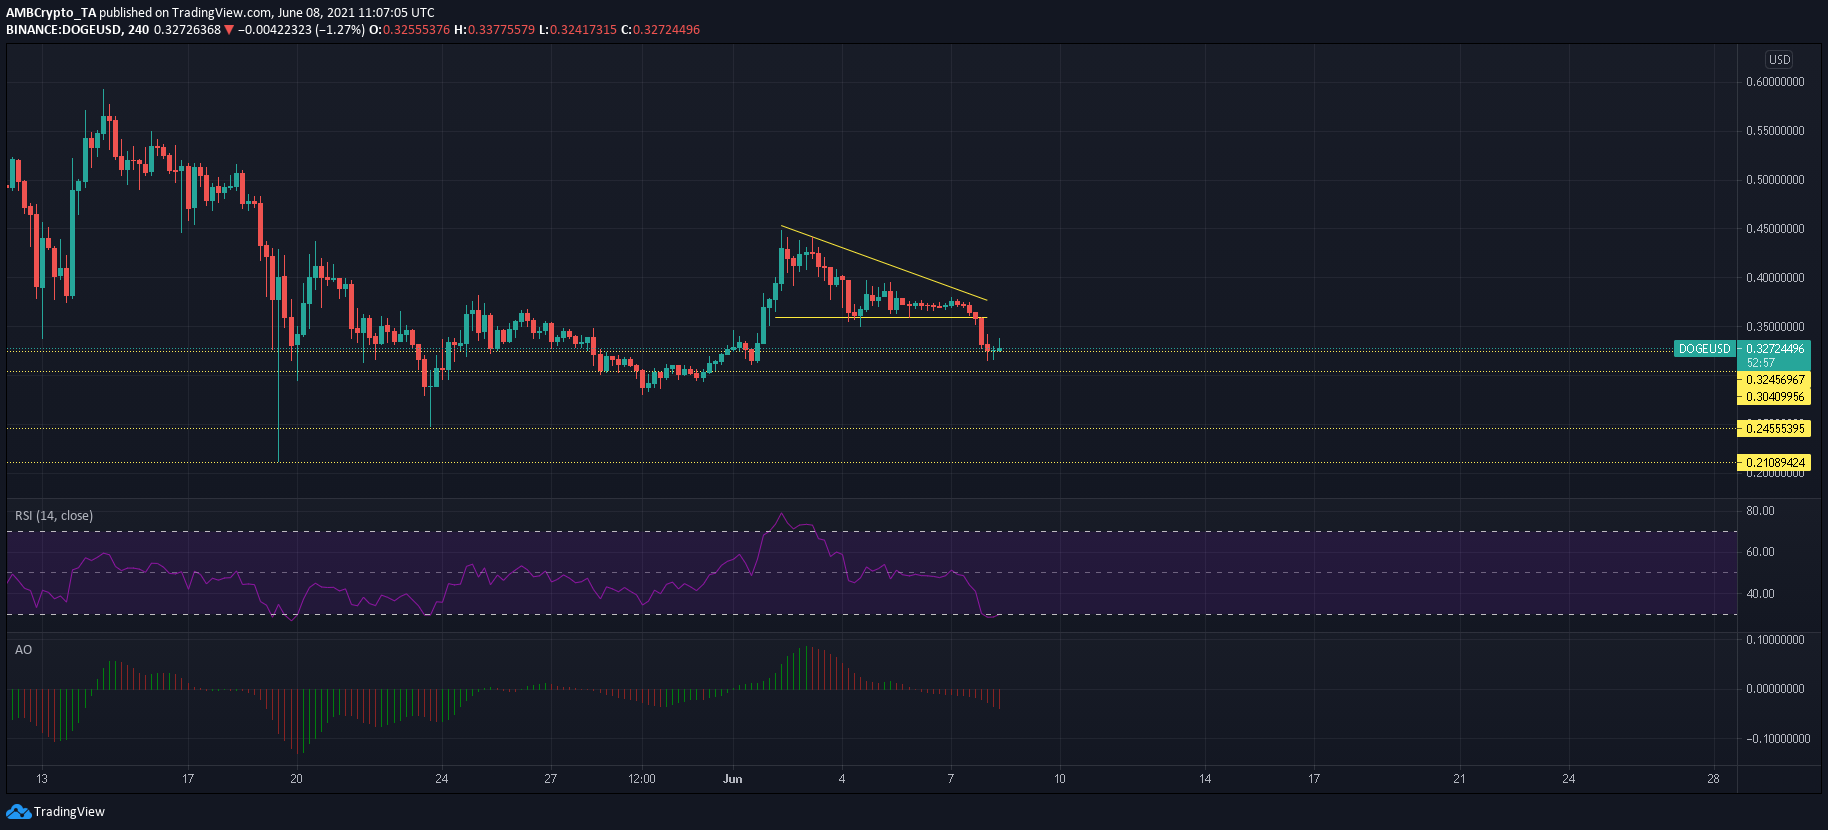
Dogecoin broke south of its descending triangle and headed towards a strong support zone between $0.32 and $0.30. Reliability of this area was highlighted on multiple occasions over the last month. It was the starting point of DOGE’s rally in late April (prior to SNL saga) which eventually led to gains of over 100%. The zone was also in focus during the last week of May, triggering minor rallies due after correctional periods.
RSI touched the oversold zone and a bounce-back can be expected moving forward. However, bearish momentum was building up on the Awesome Oscillator and a breakdown could trigger a 20% fall towards $0.245-support.
Tron [TRX]

Source: TRX/USD, TradingView
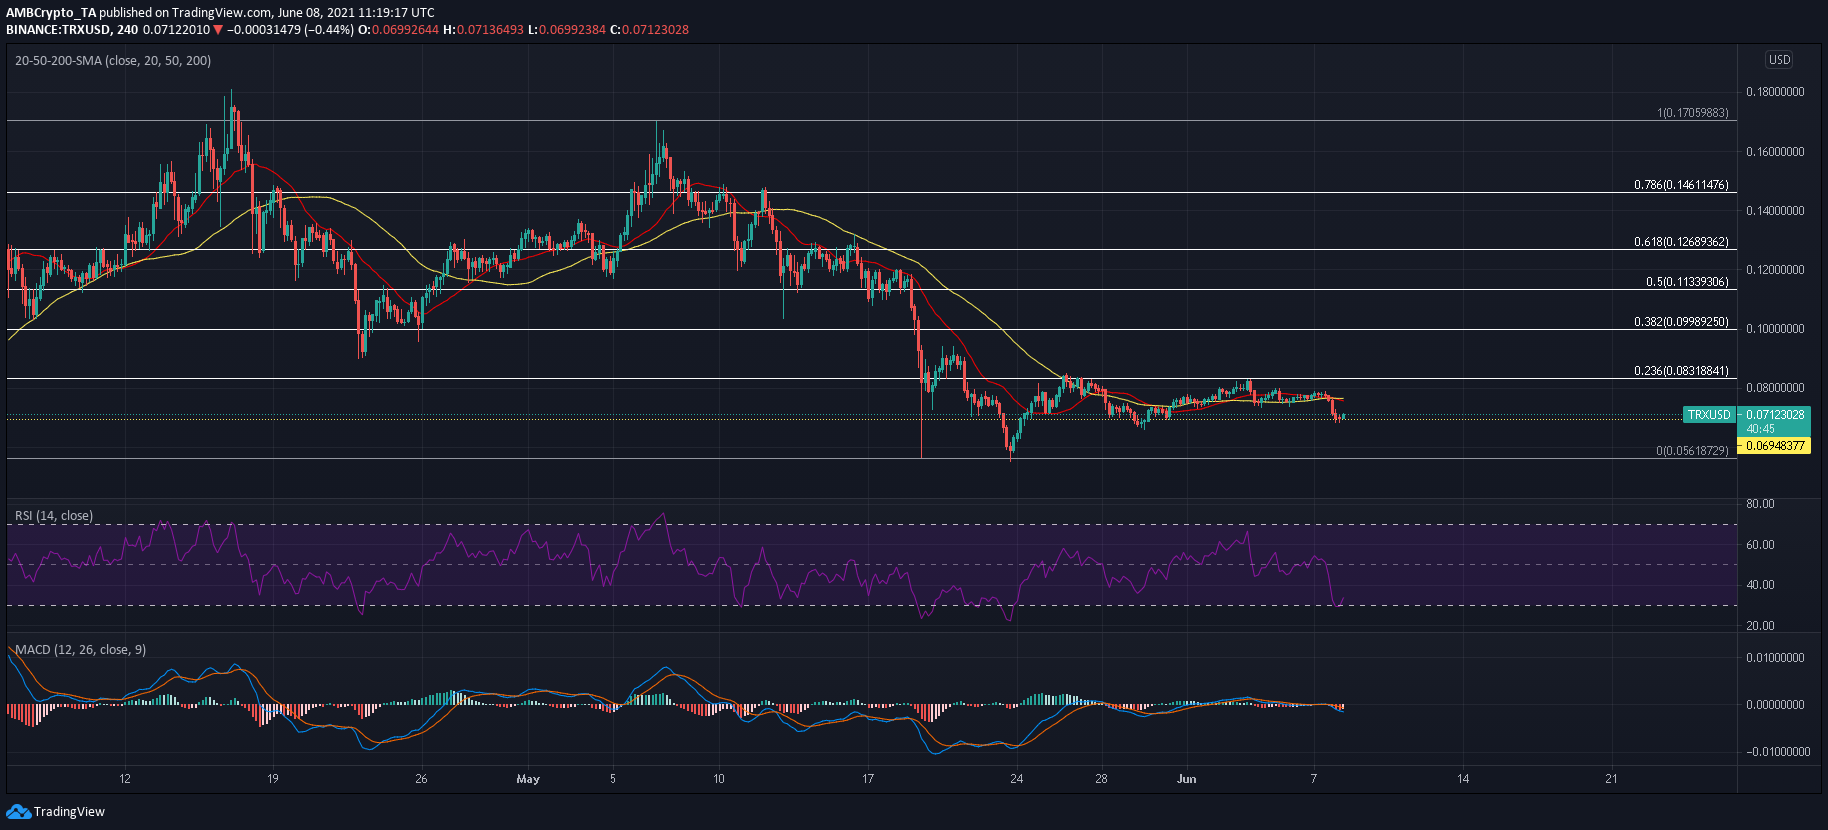
Tron’s price remained restricted below its 23.6% Fibonacci level ($0.083) over the past few days but a 9% pullback saw the candlesticks slip below their 20 (red) and 50 (yellow) SMA’s. According to Squeeze Momentum Indicator, volatility was picking up and TRX could be in for some more losses moving forward. A breakdown from $0.069 could result in an additional 20% loss towards $0.056. Even if the market takes a bullish U-turn, gains would likely be capped at the 23.6% Fibonacci level which formed a stiff resistance.
Even though RSI was expected to reverse direction from oversold conditions, it would likely remain below 40 over the coming sessions.


