Binance Coin, Filecoin, Tron Price Analysis: 13 June

The recent market fall has led to traders rushing toward sell-offs, even as Bitcoin’s price started to consolidate. The king coin’s downtrend on June 12, which led to an over 6% fall in valuation, was followed by several alts such as Binance Coin, Filecoin, and Tron’s TRX. Breaking through important support levels, these coins also faced rising selling pressure and depleting capital inflows. Their south-bound movement kept them vulnerable to additional losses going forward.
Binance Coin [BNB]
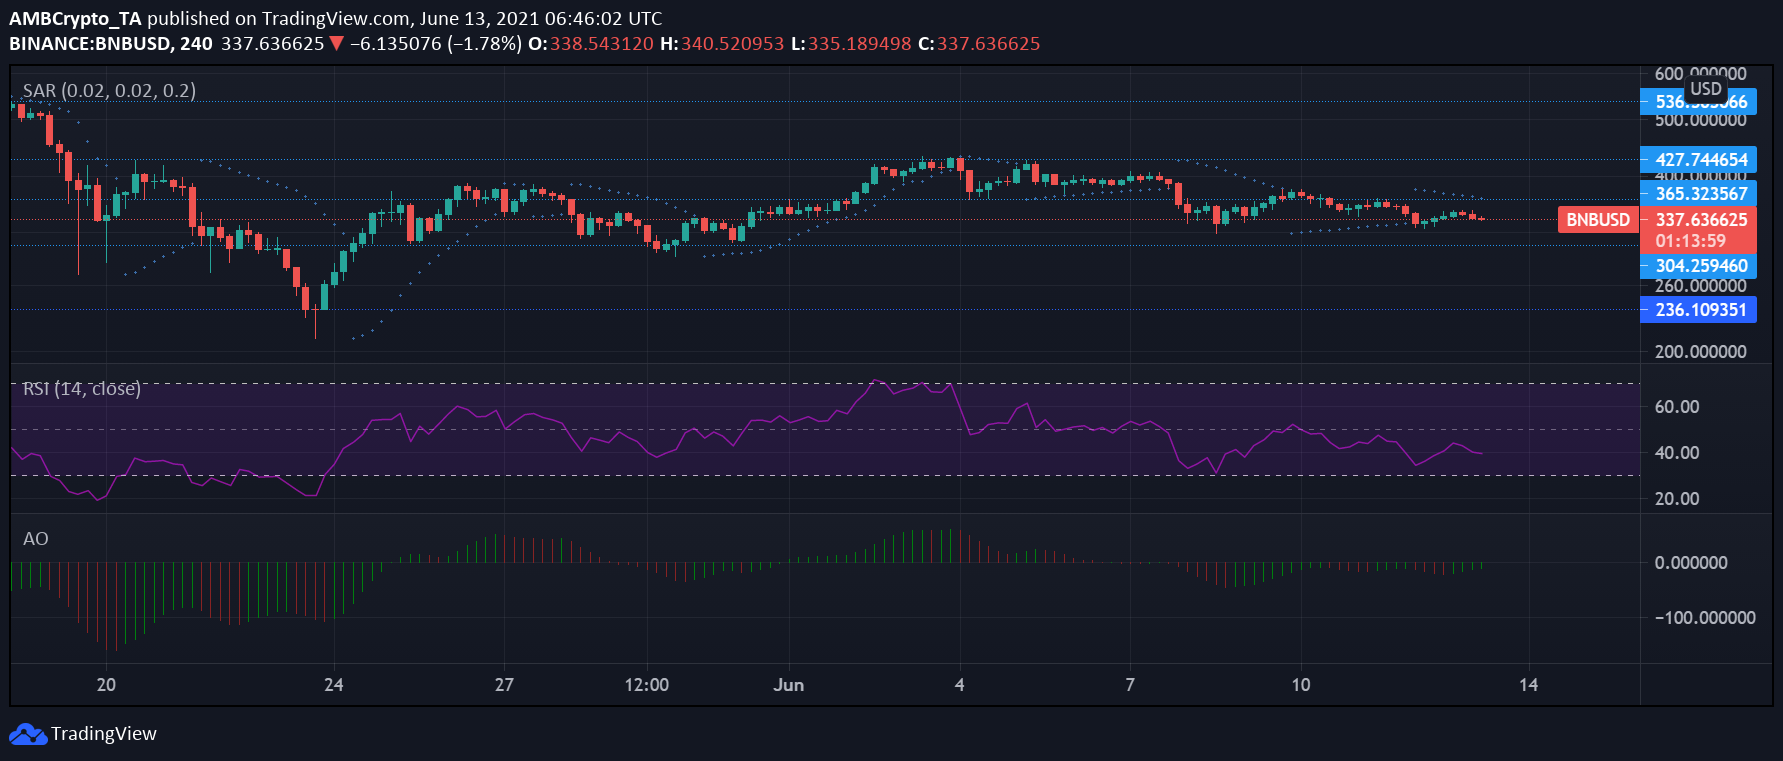
Binance Coin continued on its downtrend. After gaining over 33% just between May 31 and June 2, its valuation fell by 20% during June 7-9. Still trading in the red, the coin was priced at $337.8 at press time. After testing resistance at $365, it had fallen a further 13.2% over the past week.
Relative Strength Index or RSI dipped below the median line on June 10 to 39.8 at press time. If selling pressure continues to mount, the coin could be headed for the oversold zone. As Parabolic SAR’s dotted line hovered above the candlesticks, a downtrend for the price action could be noted.
However, according to Awesome Oscillator’s histogram, bullish momentum could be seen creeping in although it was too early to declare a positive price movement based on the indicator alone.
The support at $304 remained strong and could act as a savior if BNB continues its downward movement.
Filecoin [FIL]
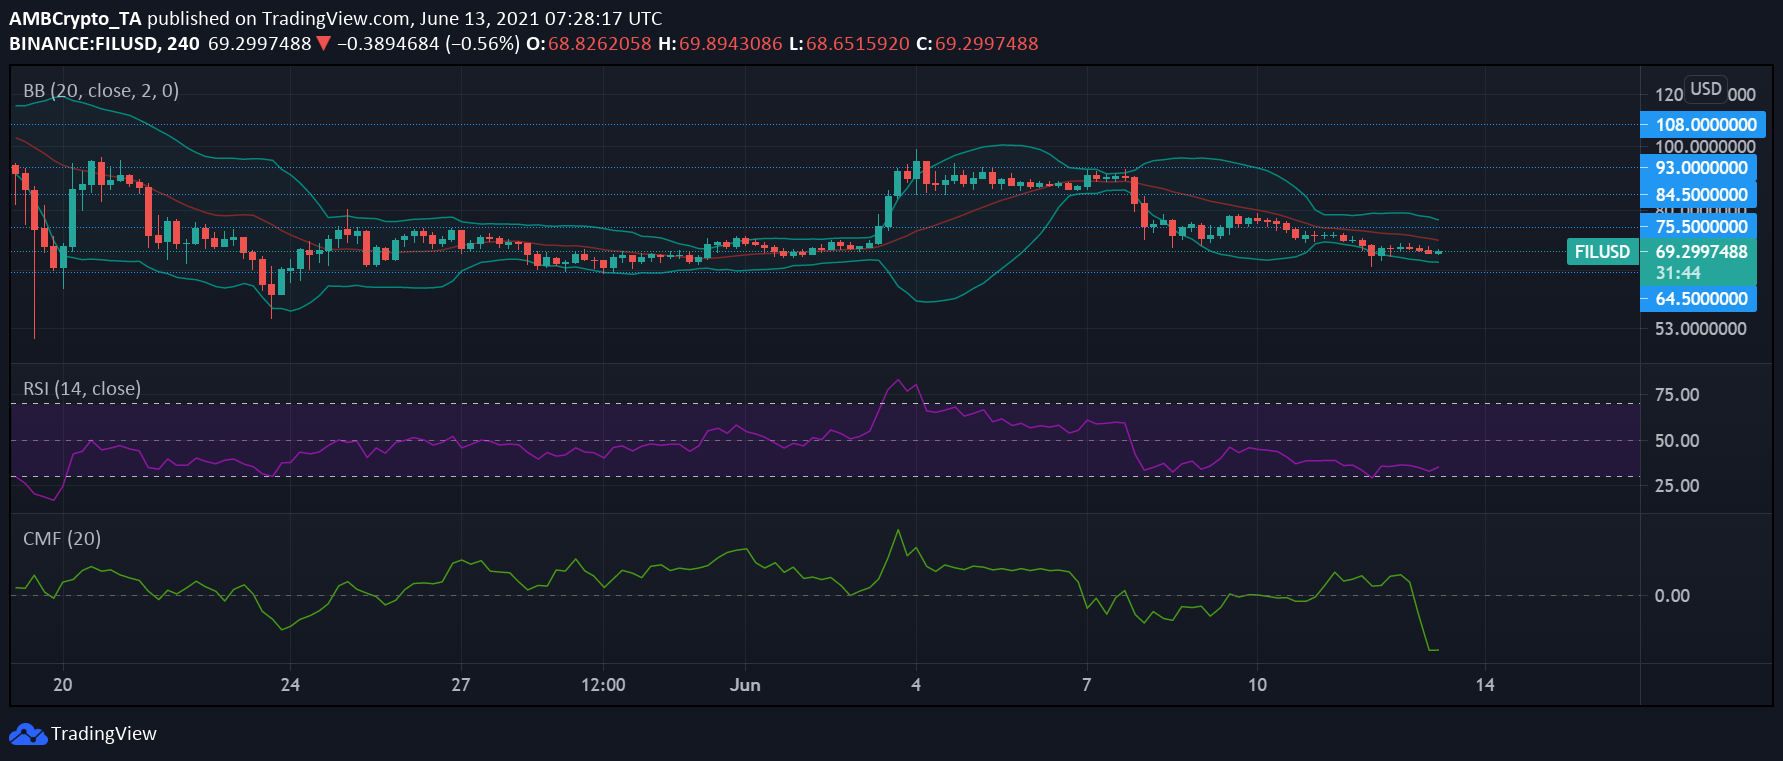
Filecoin lost 26% of its valuation during the market reduction on June 7. The coin fell through support lines at $84.5 and $75.5 and had since lost further valuation during the price fall on June 11. It was trading at $69 and saw slight gains on the four-hour chart with the emergence of a green candlestick at press time.
Chaikin Money Flow indicated that traders rushed to sell their holdings on June 12, as the capital outflows mounted way over the inflows. Selling pressure also continued to be overpowering, as Relative Strength Index continued to hover over the oversold region since June 8. The convergence of the Bollinger Bands did highlight the reduced volatility of the market and price action could be constricted going forward.
Tron [TRX]

The blockchain network recently hit several milestones. Tron’s daily active users hit an all-time high of 5.26 million, while the total daily transaction count has also hit an all-time high of 6.22 million on Tuesday.
Nevertheless, Bitcoin’s retracement on June 10-11 proved to be detrimental to Tron, which fell by over 12% during this time. The coin broke through its support at $0.069 but found new support at the $0.065 mark, with the former acting as a strong resistance. The 24-hour trading volume for the coin also fell by 31% over the past day.
Bollinger Bands remained diverged during this time, indicating that market volatility was picking up. The appearance of a red line below Awesome Oscillator’s histogram suggested that bullish momentum was starting to surface on the coin’s price action. Moreover, MACD’s histogram closed in one a bullish crossover, even as the lines remained below the equilibrium and moved in alignment with one another.
Since the indicators suggest that bearish momentum is declining, TRX could defend $0.065 support from a breakdown. In case the support is broken, the coin could face a plunge of over 20% towards the next support at $0.055.


