Binance Coin, Filecoin, Waves Price Analysis: 18 December

BNB tested the $532.8-mark after facing strong resistance while Filecoin formed a descending triangle. Their near-term technicals flashed bearish bias. Waves, on the other hand, displayed mixed signals.
Binance Coin (BNB)

Over the past few days, BNB formed an up-channel as the bulls endeavored to retest the $532.8-mark after breaching it for a day on 16 December.
The 4-hour chart saw a longer green candlestick on 18 December as the price bounced back from the lower channel (yellow) and crossed the 20-SMA (red) hurdle.
The previous down-channel (white) saw a recovery from the $505-mark that the bulls have ensured for seven weeks now.
At press time, BNB traded 22.5% below its ATH at $532.2. The RSI felt resistance near the midline for the past eight days as it swayed near the 50-mark. Moreover, the DMI lines flashed a bearish bias. Since the last two candlesticks were on rather decreasing volumes, any break above $532.8 could be difficult to sustain.
Filecoin (FIL)

FIL witnessed a descending triangle breakdown on 3 December. Its move persistently slackened as the bulls failed to hold the $52.5-mark (20-week resistance). The price action steadily marked lower highs while the pressure started mounting on bulls to hold their ground. On 3 December, FIL poked its nine-month low at $32.5.
Over the past 14 days, FIL yet again saw a descending triangle on its 4-hour chart. Now, the bulls will strive to hold the $35.6-mark to prevent any further breakdown.
At press time, the alt traded at $36.44. While the Supertrend understandably flashed sell signals, the RSI faced immediate resistance near the midline. Further, the DMI slightly preferred the bears, but the ADX displayed a weak directional trend.
WAVES
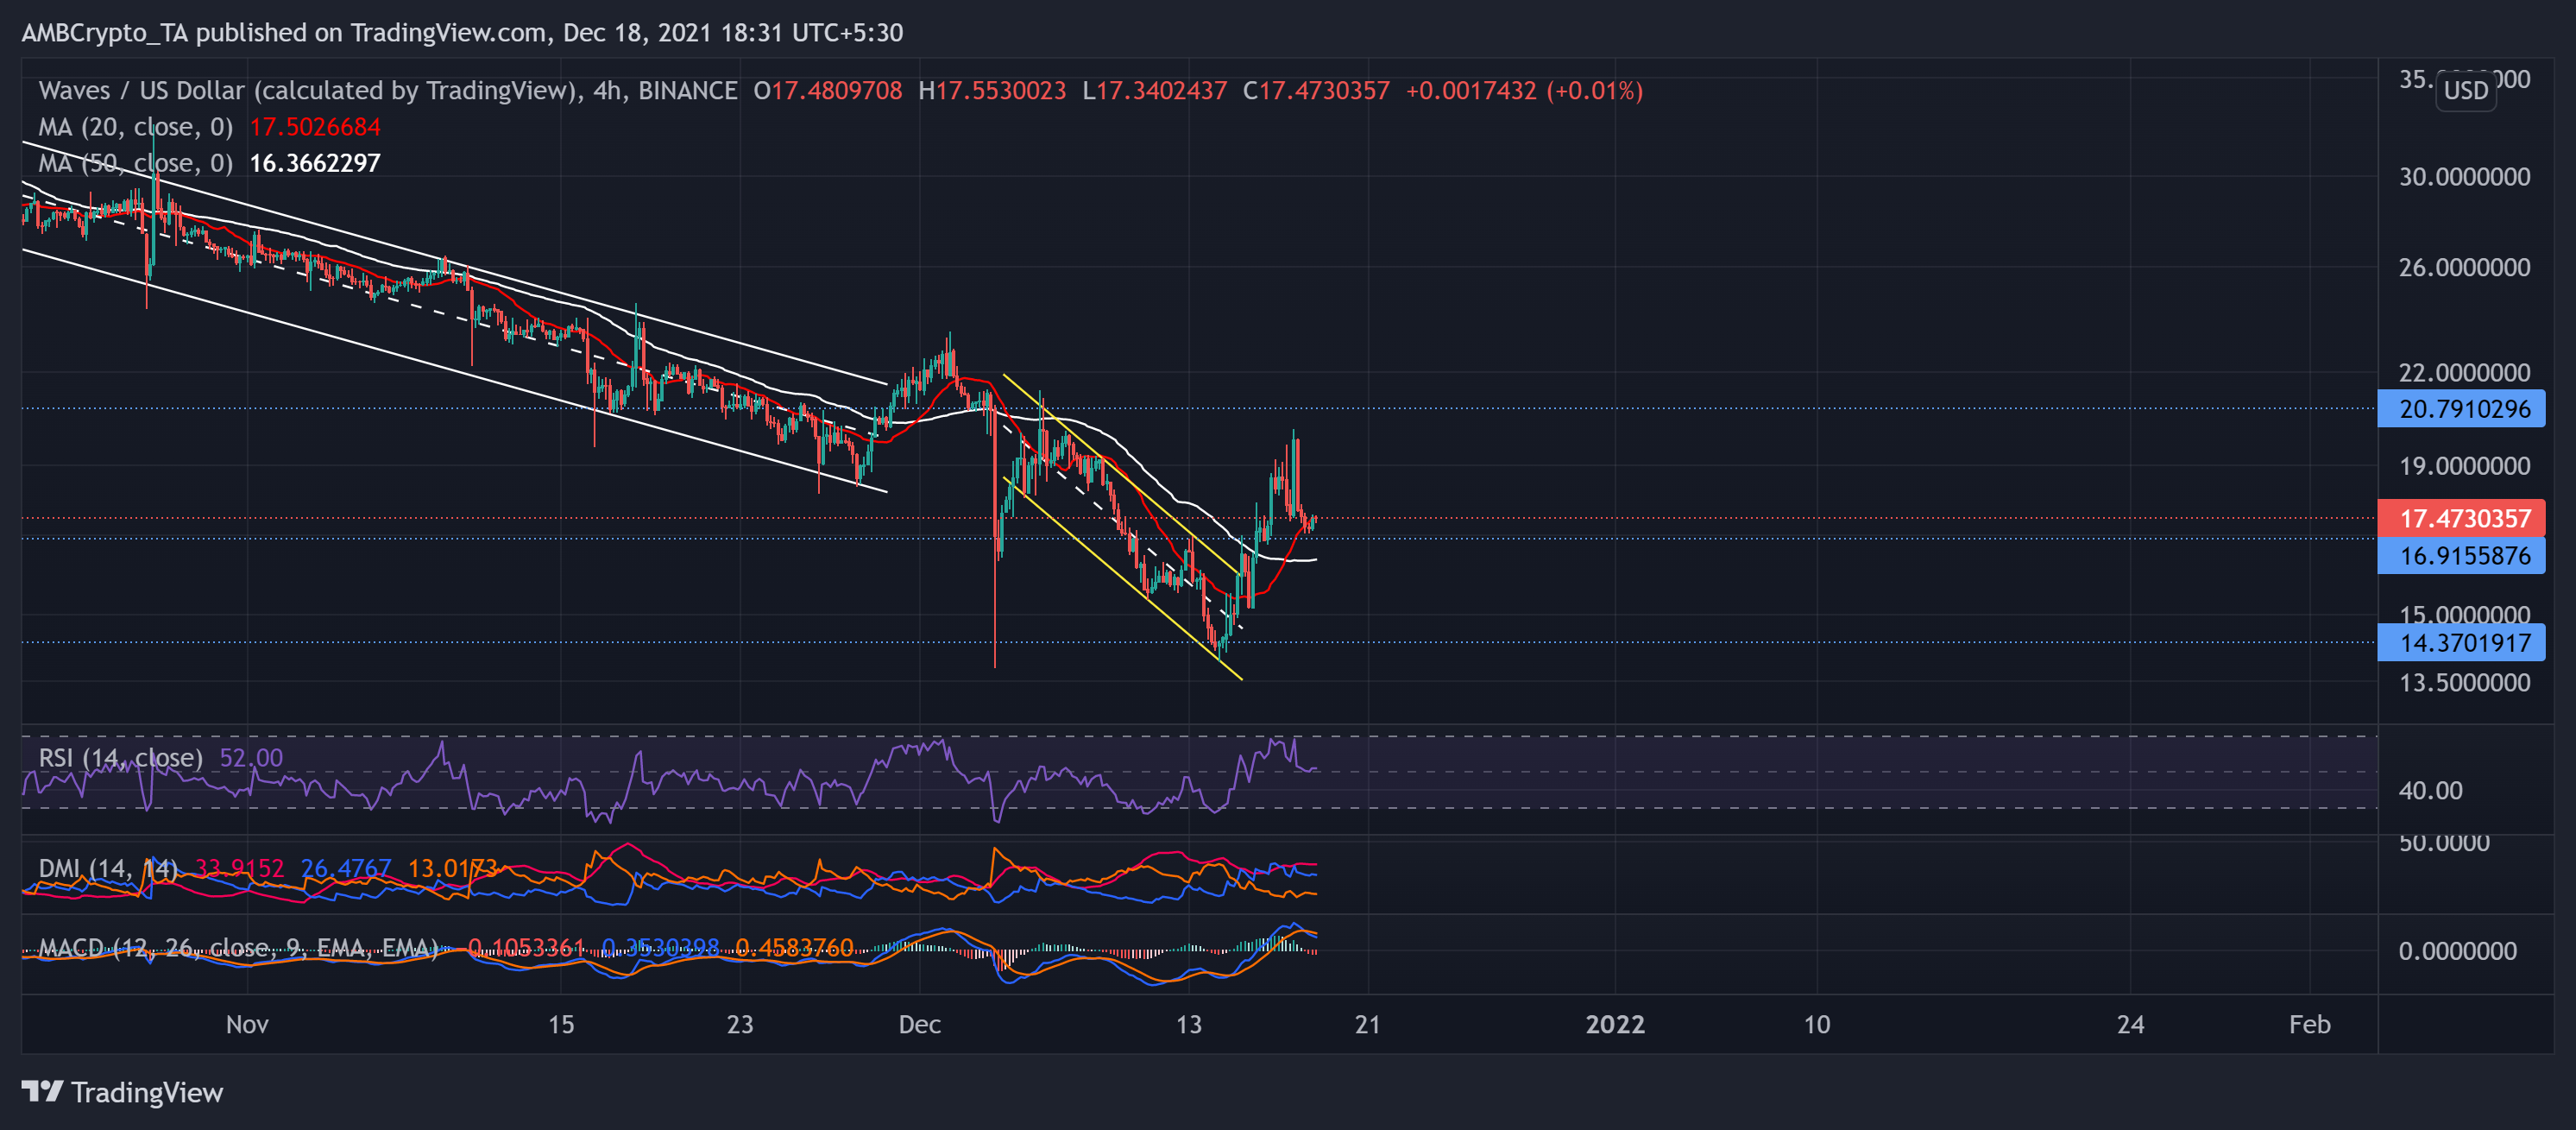
WAVES consistently fell since mid-October as it marked two down-channels and snapped off multiple resistance points. The altcoin lost nearly half of its value from 15 October till date.
Over the past few days, bears breached the $16.9 (18-week support) until the price action bounced back from its lower channel near the $14.3-mark. The down-channel breakout fueled a short-term bullish push above the 20-50 SMA. However, it saw a strong pullout immediately on 17 December.
At press time, WAVES traded at $17.47. The RSI dipped from the overbought region toward the midline and moved sideways. The DMI preferred the bulls with a high directional trend. Nevertheless, the MACD histogram flashed red signs after falling below the zero-line.


