
‘Risks to inflation are tilted to the upside’: Can Bitcoin ride this to $120K?

While Bitcoin has broken above $60,000 for the first time since April, the altcoin industry showed mixed trading sessions. Some coins such as MIOTA and FTM declined slightly, whereas BNB registered a modest increase on its charts.
Binance Coin (BNB)
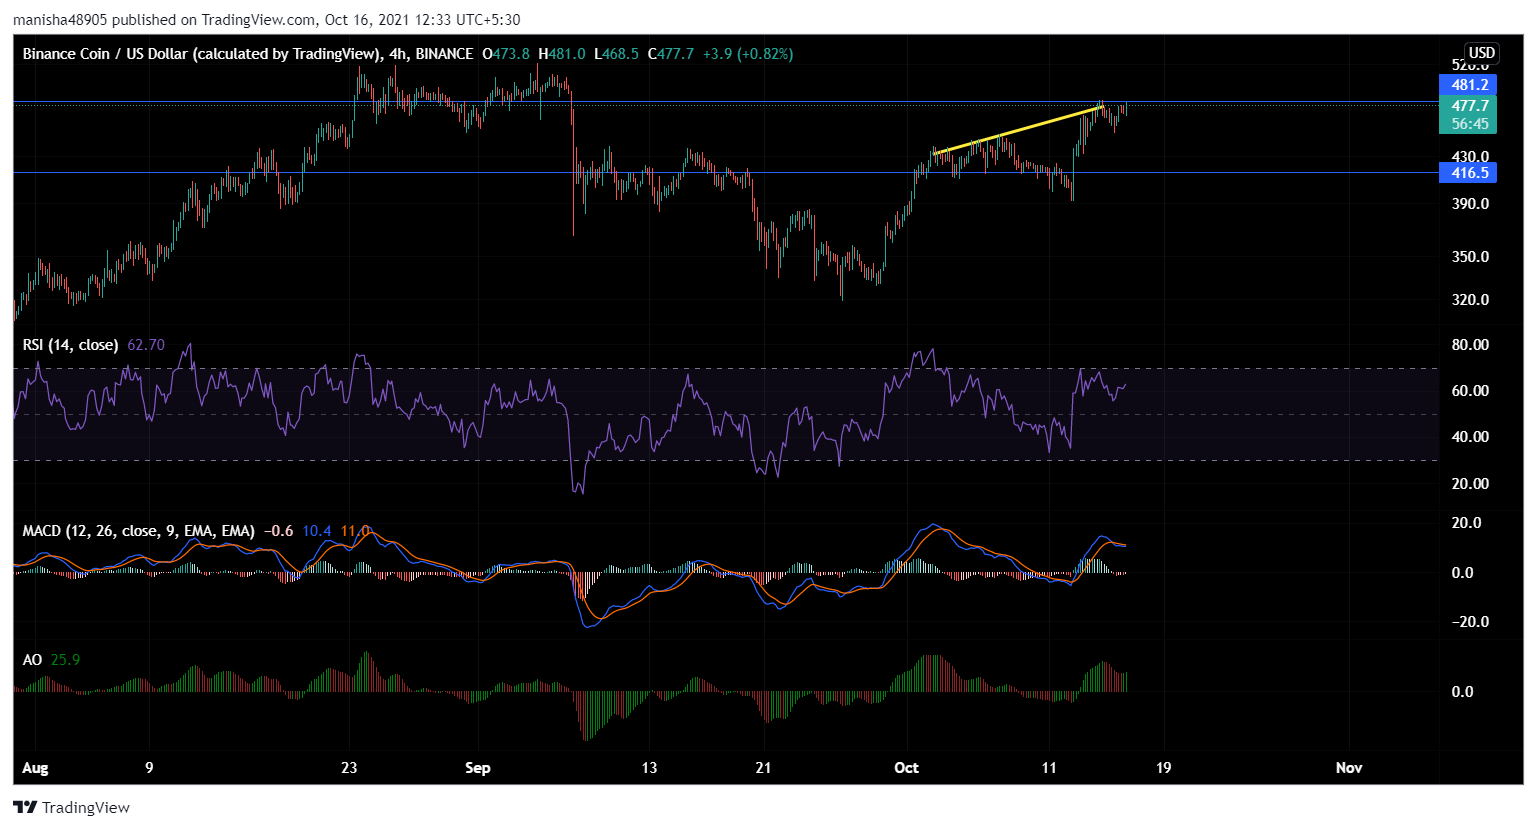
Source: BNB/USD, TradingView
BNB moved up by 2.71% and was trading at $479, at the time of writing. The immediate resistance stood at $481 while the support was marked at $416. If the price rises from the current level and breaches above $518, it will signal that bulls have overtaken the market.
The Relative Strength Index was near the 60-mark, thus indicating that buying strength existed in the market. If the RSI further moves up to reach 70-mark, a trend reversal, in that case, can’t be ruled out. MACD with its green signal bars approached a bullish crossover, however, it didn’t appear going towards the middle line. Awesome Oscillator highlighted green signal bars depicting that the current market isn’t really favorable for sellers.
IOTA

Source: IOTA/USD,TradingView
IOTA showed signs of consolidation on its four-hour chart and was trading sideways. It dropped by 2.02% to reach $1.29. Over the last week, the coin oscillated within the range of $1.17 to $1.51. If IOTA manages to break its lateral trading and move on the upside, the first resistance will be at $1.75 and then at $1.96. Trading above these levels could propel the price to reattempt testing the multi-month high of $2.
Technical pointed towards negative price action. RSI stood at a 40-mark indicating that it’s time for sellers to take advantage of the market. MACD showed red signal bars and approached a bearish crossover below the middle line. If it continues to go down, the buyers may face difficult days ahead. Awesome Oscillator verified the same. It flashed red signal bars implying negative price action. A macro view suggested the market for IOTA appeared bearish.
Fantom (FTM)
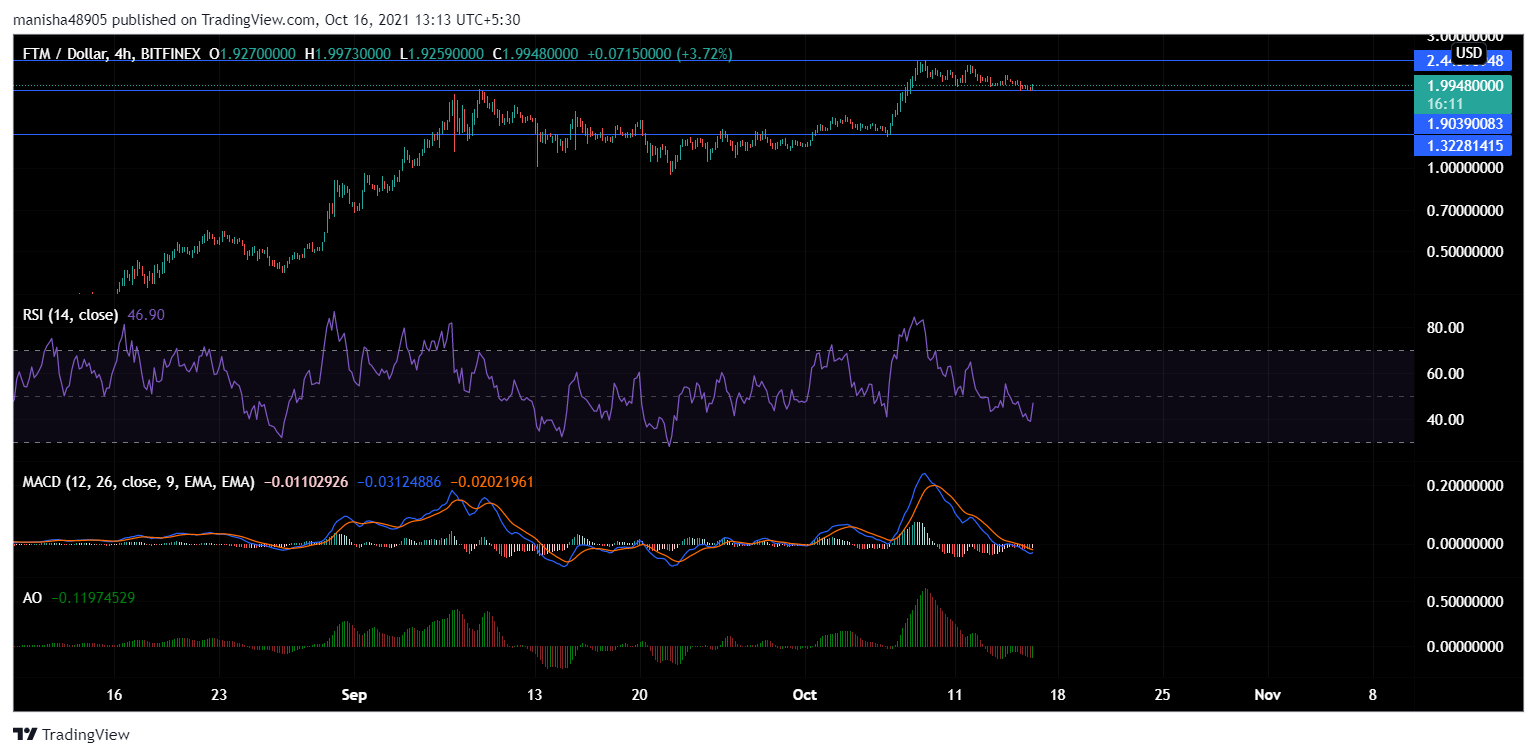
Source: FTM/USD,TradingView
Fantom was trading at $1.9 down by 3.3%, at press time. FTM’s price has been consolidating within a rather narrow range between $1.9 and $2.4 for quite some time. If the price of Fantom moves below $1.9, it will then march towards its support level at $1.3. As the price tries to gain momentum, the market for FTM appears to be in favor of sellers.
RSI is near a 40-mark eyeing retracement- a sign that selling pressure has been easing over the last few hours. MACD and Awesome Oscillator flashed red signal bars on its histogram, potential sell signal can be noticed here. Further, pointing that bearish movement in price is dominant.


