Binance Coin, NEM, Decred, DigiByte Price Analysis: 31 March

A move below the 50-SMA could see Binance Coin slip towards its $254.9-support. NEM resumed its movement between $0.409 and $0.313, while the technicals on Decred suggested exhaustion from record levels. Finally, DigiByte held on to the 50% Fibonacci retracement level, but the market bulls were expected to be tested over the next few trading sessions.
Binance Coin [BNB]
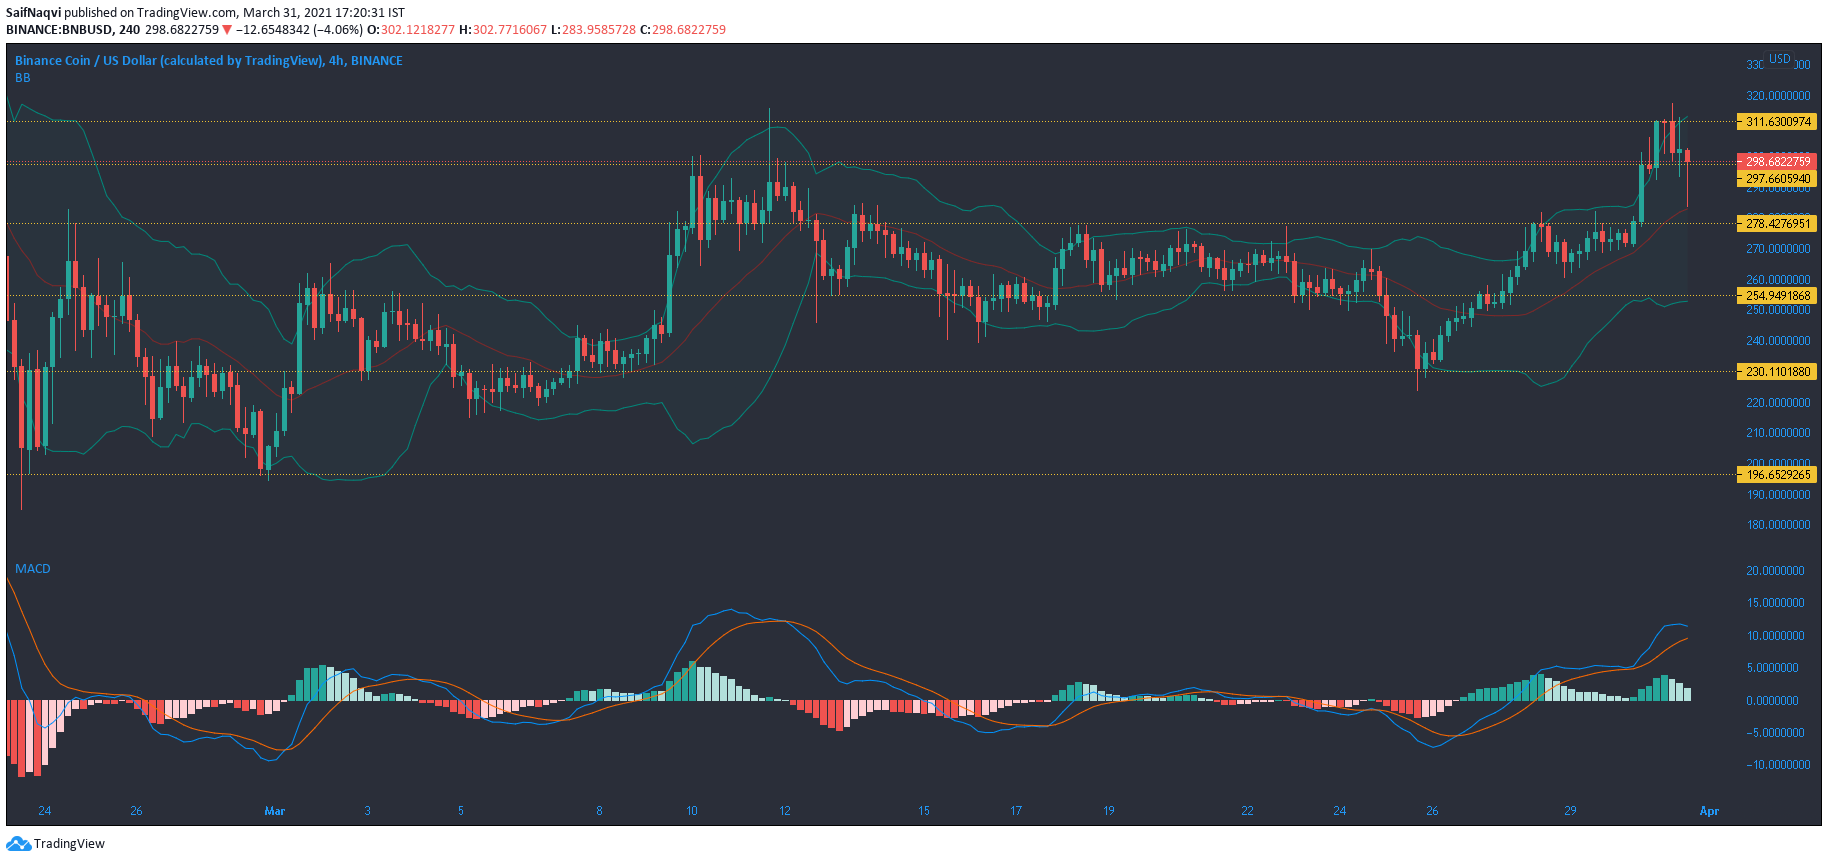
Volatility was on the up in the Binance Coin market since the price bounced back from the $230.10-support. The candlesticks moved lower after trading on the upper bands of the Bollinger Bands, and a move below the Signal line (50-SMA) could lead to additional losses towards the $254.9-support.
The MACD’s histogram noted weakening momentum, while the Signal line gained some ground on the fast-moving line. Even though BNB could stabilize at lower levels, its healthy uptrend would likely carry it above the $311.6-ceiling and towards record levels over the short-term.
NEM [XEM]
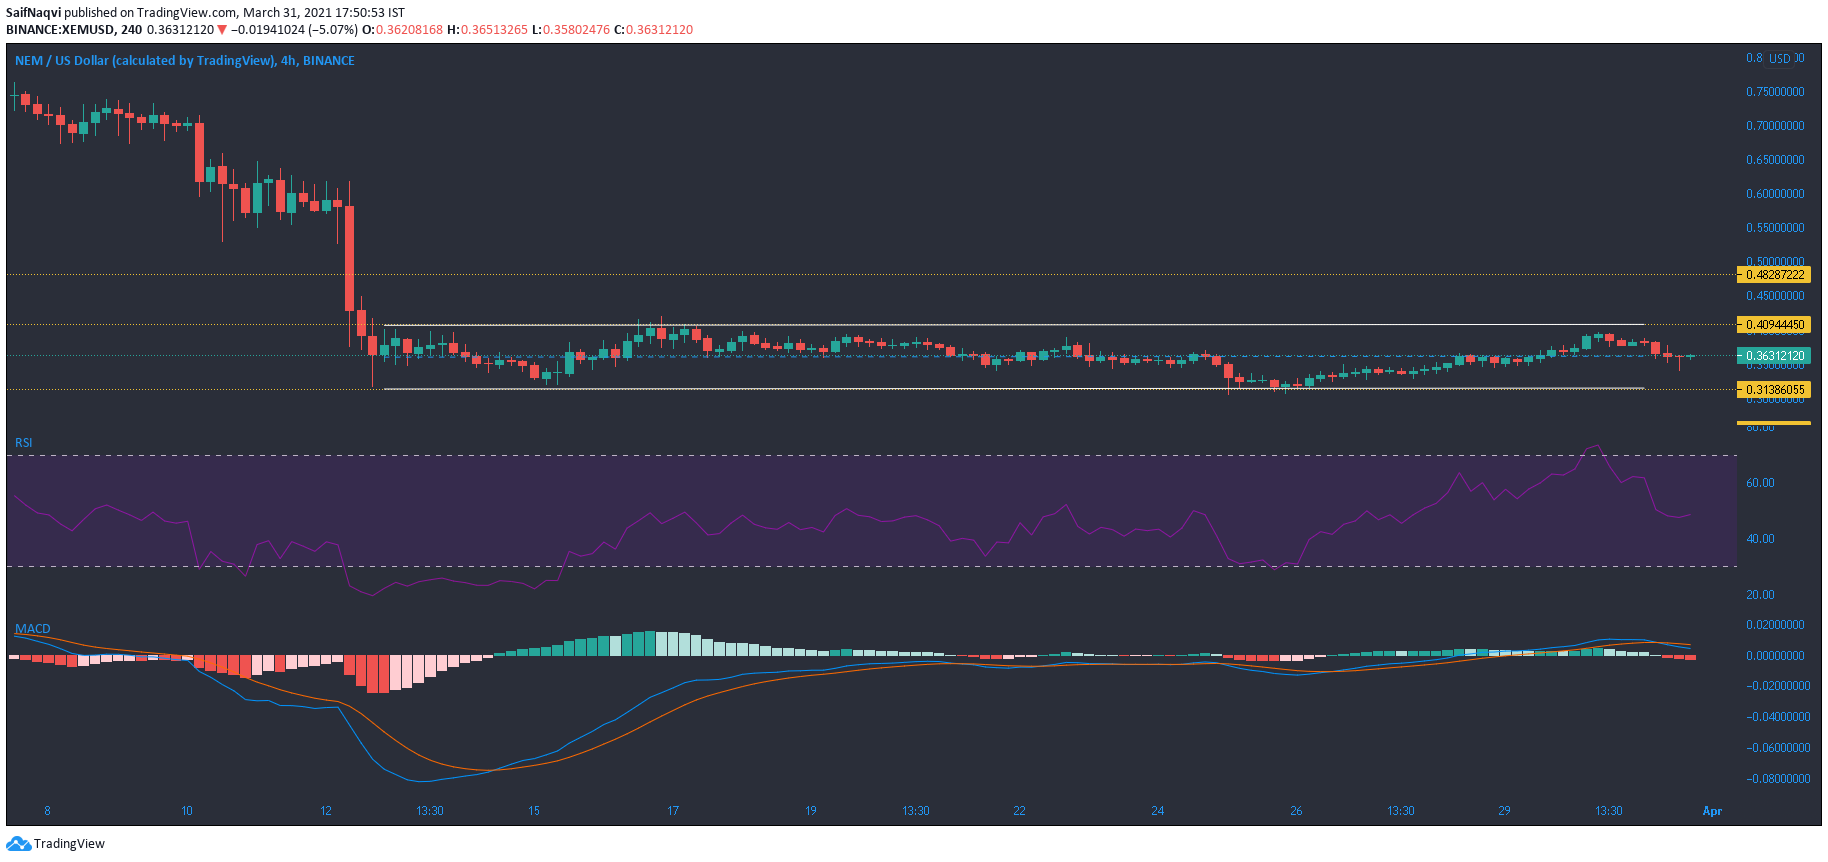
There were few developments in the NEM market as the price continued its rangebound movement between $0.409 and $0.313. The MACD did witness a bearish crossover, but a break below the channel seemed unlikely. Since the price slipped under the mid-point of its horizontal channel, a move towards the lower trendline seemed possible over the coming sessions.
The RSI was pointing slightly upwards around the 50-mark, but it reflected a degree of equilibrium in the price. The 24-hour trading volume dropped by 22% and clocked in at $330 million. A hike in the same could signal sharper price movements going forward.
Decred [DCR]
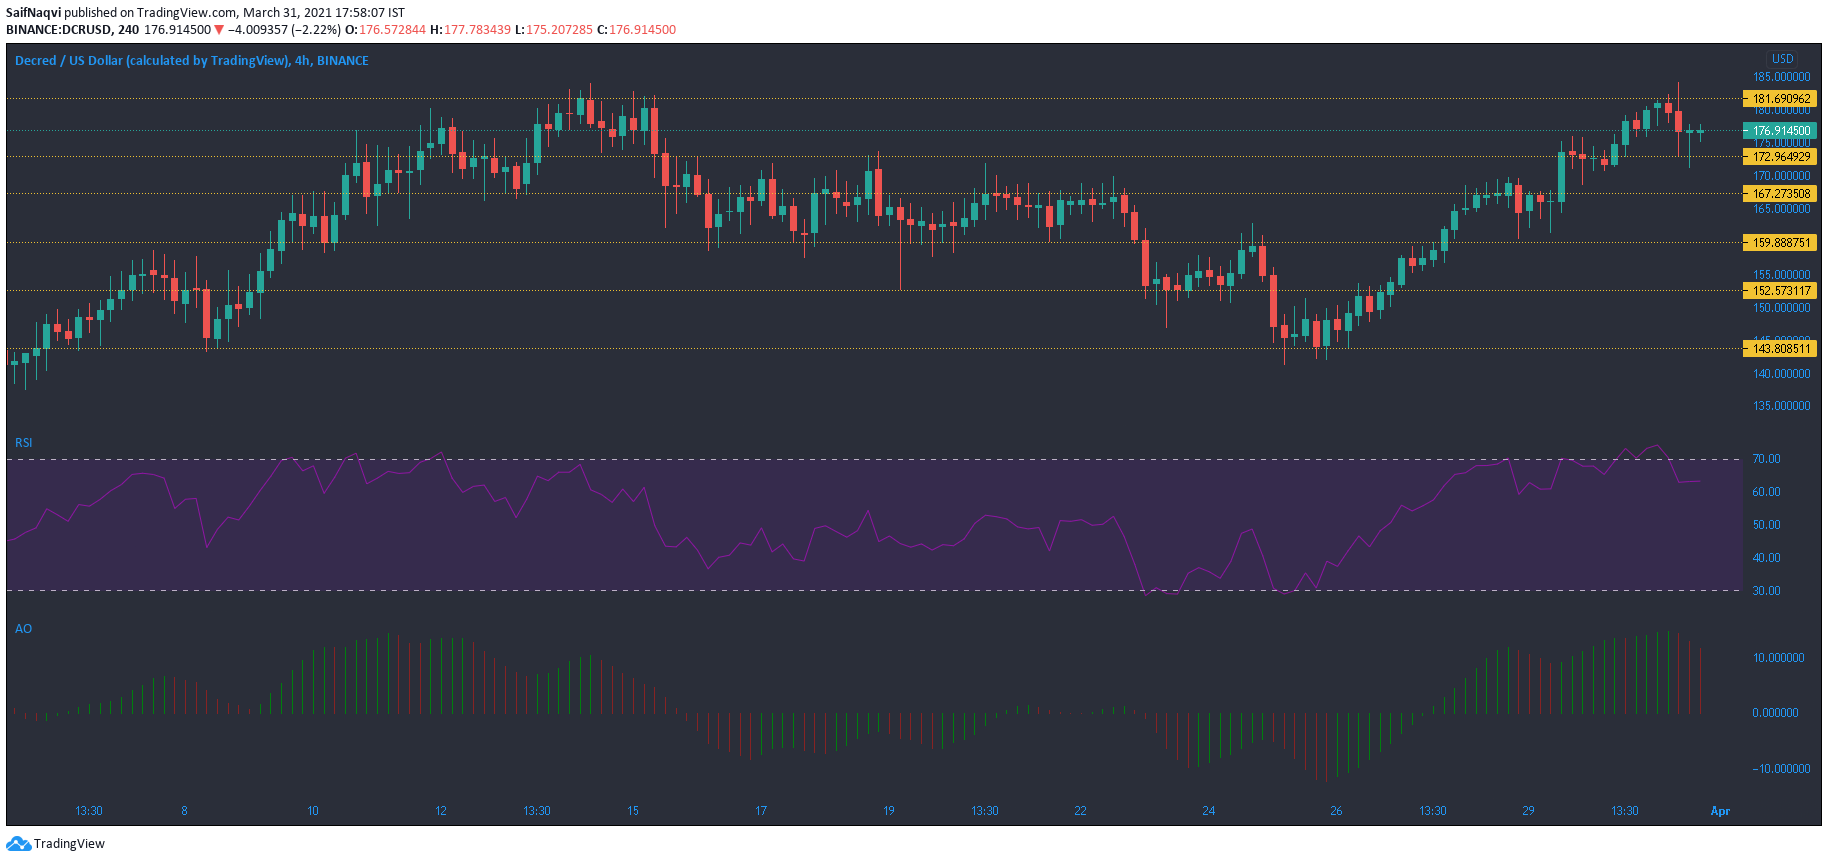
Gains over the last 5 days climbed by over 20% and highlighted a strong recovery for Decred after the price bounced back from the $143.8-support. However, at the time of writing, some bearishness was noted in the price after it breached its previous ATH and set a new record at $184.1.
The RSI slipped beneath the overbought zone and settled above the 60-mark, while the Awesome Oscillator posted a series of red bars. Support levels resided at $172.96 and $167.27 if the price moves south over the short-term.
DigiByte [DGB]
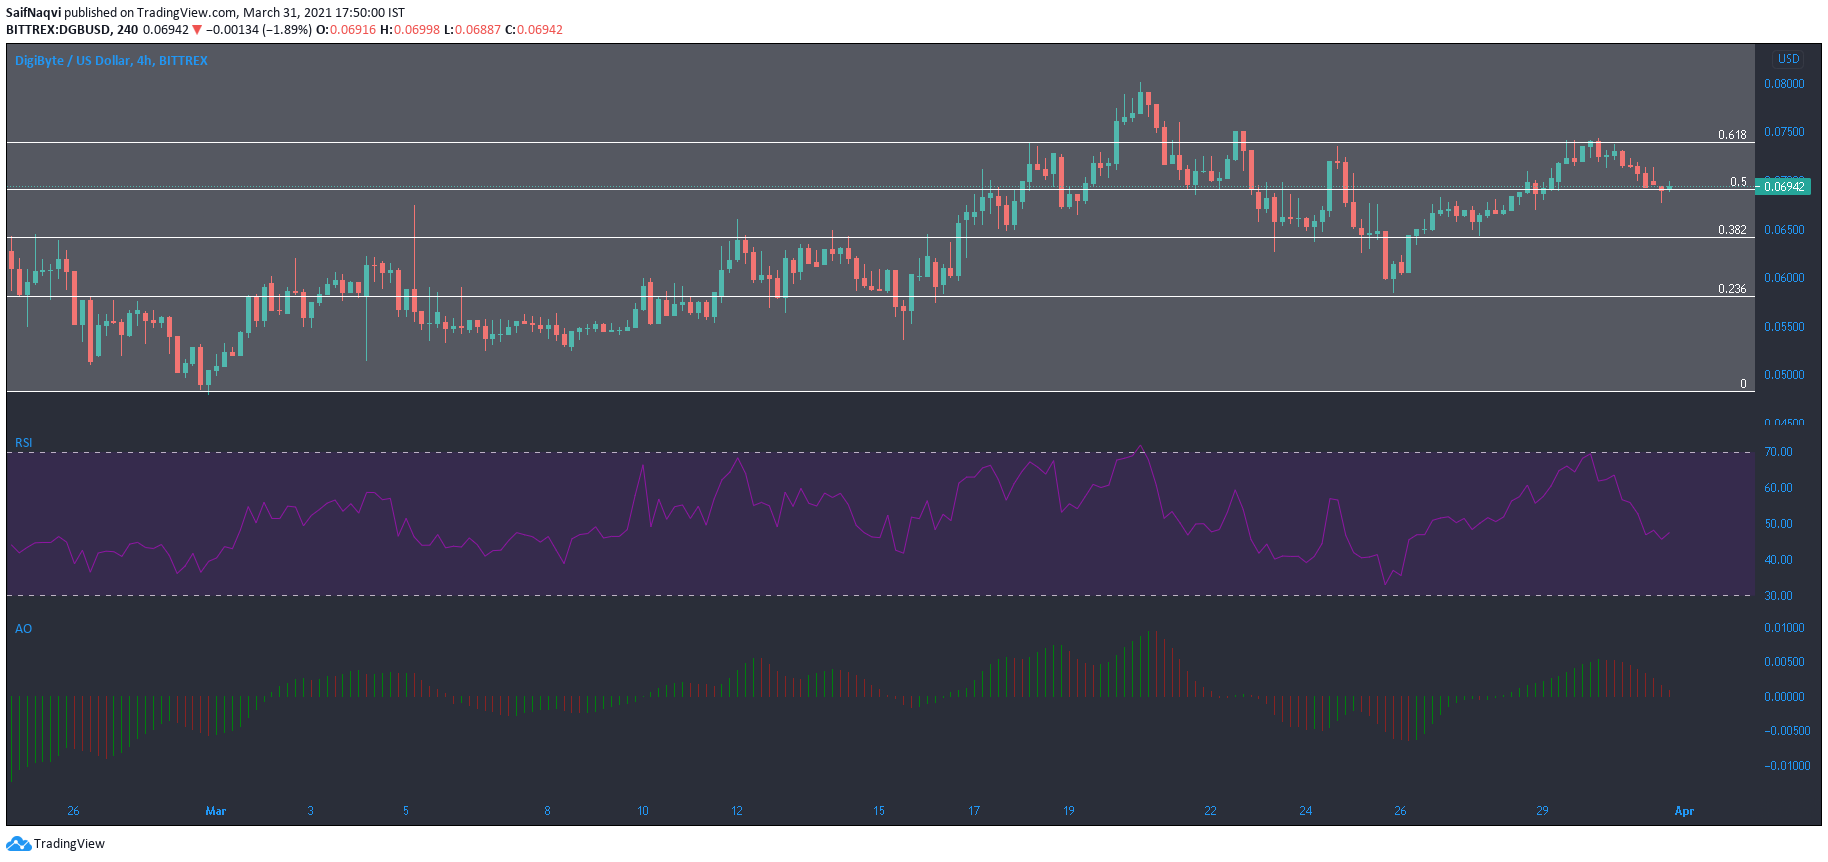
DigiByte reversed trajectory after failing to overturn the 61.8% Fibonacci retracement level at $0.07. This led to losses in the market, but the bulls managed to cushion the fall at the 50% Fibonacci level. The press time region was important to hold on to for the bulls for a comeback towards its local high. A dip below this channel could lead to extended losses towards $0.06.
According to the Awesome Oscillator, momentum rested with the sellers and a breakdown seemed likely on the 4-hour timeframe. However, the RSI was pointing north from near 50 as the buyers sought to regain some control of the market.