
While Bitcoin and Ethereum reflect a highly volatile market ridden with sudden pumps and drastic dumps, Binance Coin [BNB] market handled the overall volatility by registering a stable surge.
At the press time, BNB was increased by 7% in nine hours and was currently trading at $595.44. Meanwhile, other altcoins like Polkadot [DOT] and Uniswap [UNI] were also seen consolidating at a higher trading range.
Binance Coin [BNB]

Source: BNBUSD on TradingView
The above chart suggested that BNB hit resistance at $614 after which it retraced. The value dropped to $593 as selling pressure saw a marked increase. This pressure opened the market to a lot more volatility as the price continued its descent.
The surging price pushed BNB into the overbought zone without any correction. This unstable market thus hit an inflection point to acquire a sturdy price level and dropped. Relative strength index dropped under the overbought zone and was now at 60. Meanwhile, selling pressure was pushing money out of the market, as indicated by the dropping value of Chaikin Money Flow.
Polkadot [DOT]
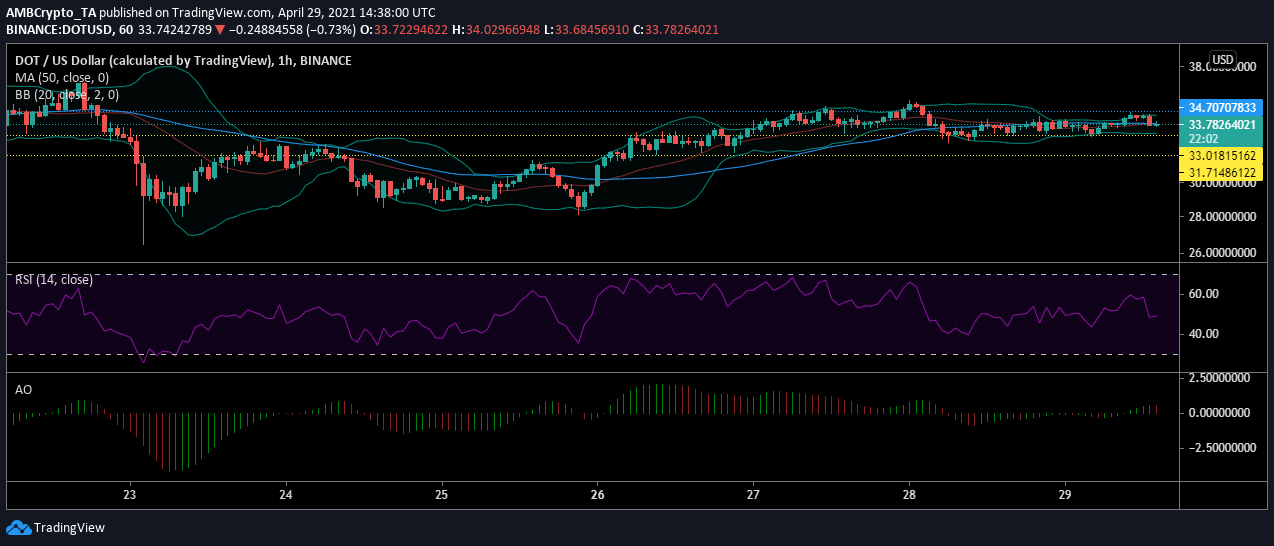
Source: DOTUSD on TradingView
Polkadot market was witnessing a long consolidation period between $33 and 34. However, the restricted price movement was giving rise to a bearish trend in the market. This was indicated by the signal line that remained intertwined with the candlesticks for the past day.
This also hinted towards a market at an equilibrium state where the buying and the selling pressures were evening each other out. This was confirmed by relative strength index which was at 49. Given the low price activity, momentum was dropping and may continue down this path over the next few trading sessions.
Uniswap [UNI]
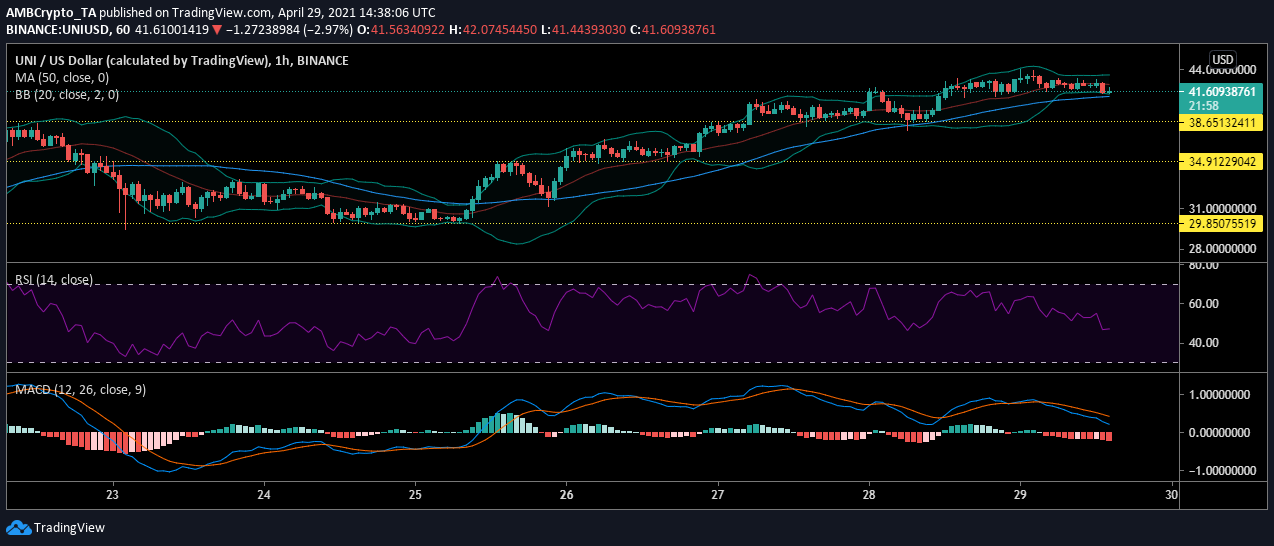
Source: UNIUSD on TradingView
Uniswap market also had a period of sharp growth before giving into consolidation. It increased from $29.85 to $42.69 within three days and then continued to trade above this level. At press time, it was testing this support, and breaching it could lead to a reactive price correction.
This was also highlighted by the falling value of the relative strength index. Until the run-up, RSI remained close to being overbought but as the price consolidated, selling pressure began to rise. The value of RSI had moved past equilibrium and was currently heading to the oversold zone. MACD line remained under the signal line and the growing distance between the two suggested increasing bearishness in the UNI market.