Binance Coin, Solana, Fantom Price Analysis: 20 November

After a substantial slump last week, most cryptos struggled to counter the selling pressure. However, over the past day, the market appeared to set foot in the recovery phase.
Altcoins like Binance Coin, Solana and Fantom touched their weekly lows on 18 November. Now, they were leading the recovery phase, noting gains in the past 24 hours.
Binance Coin (BNB)
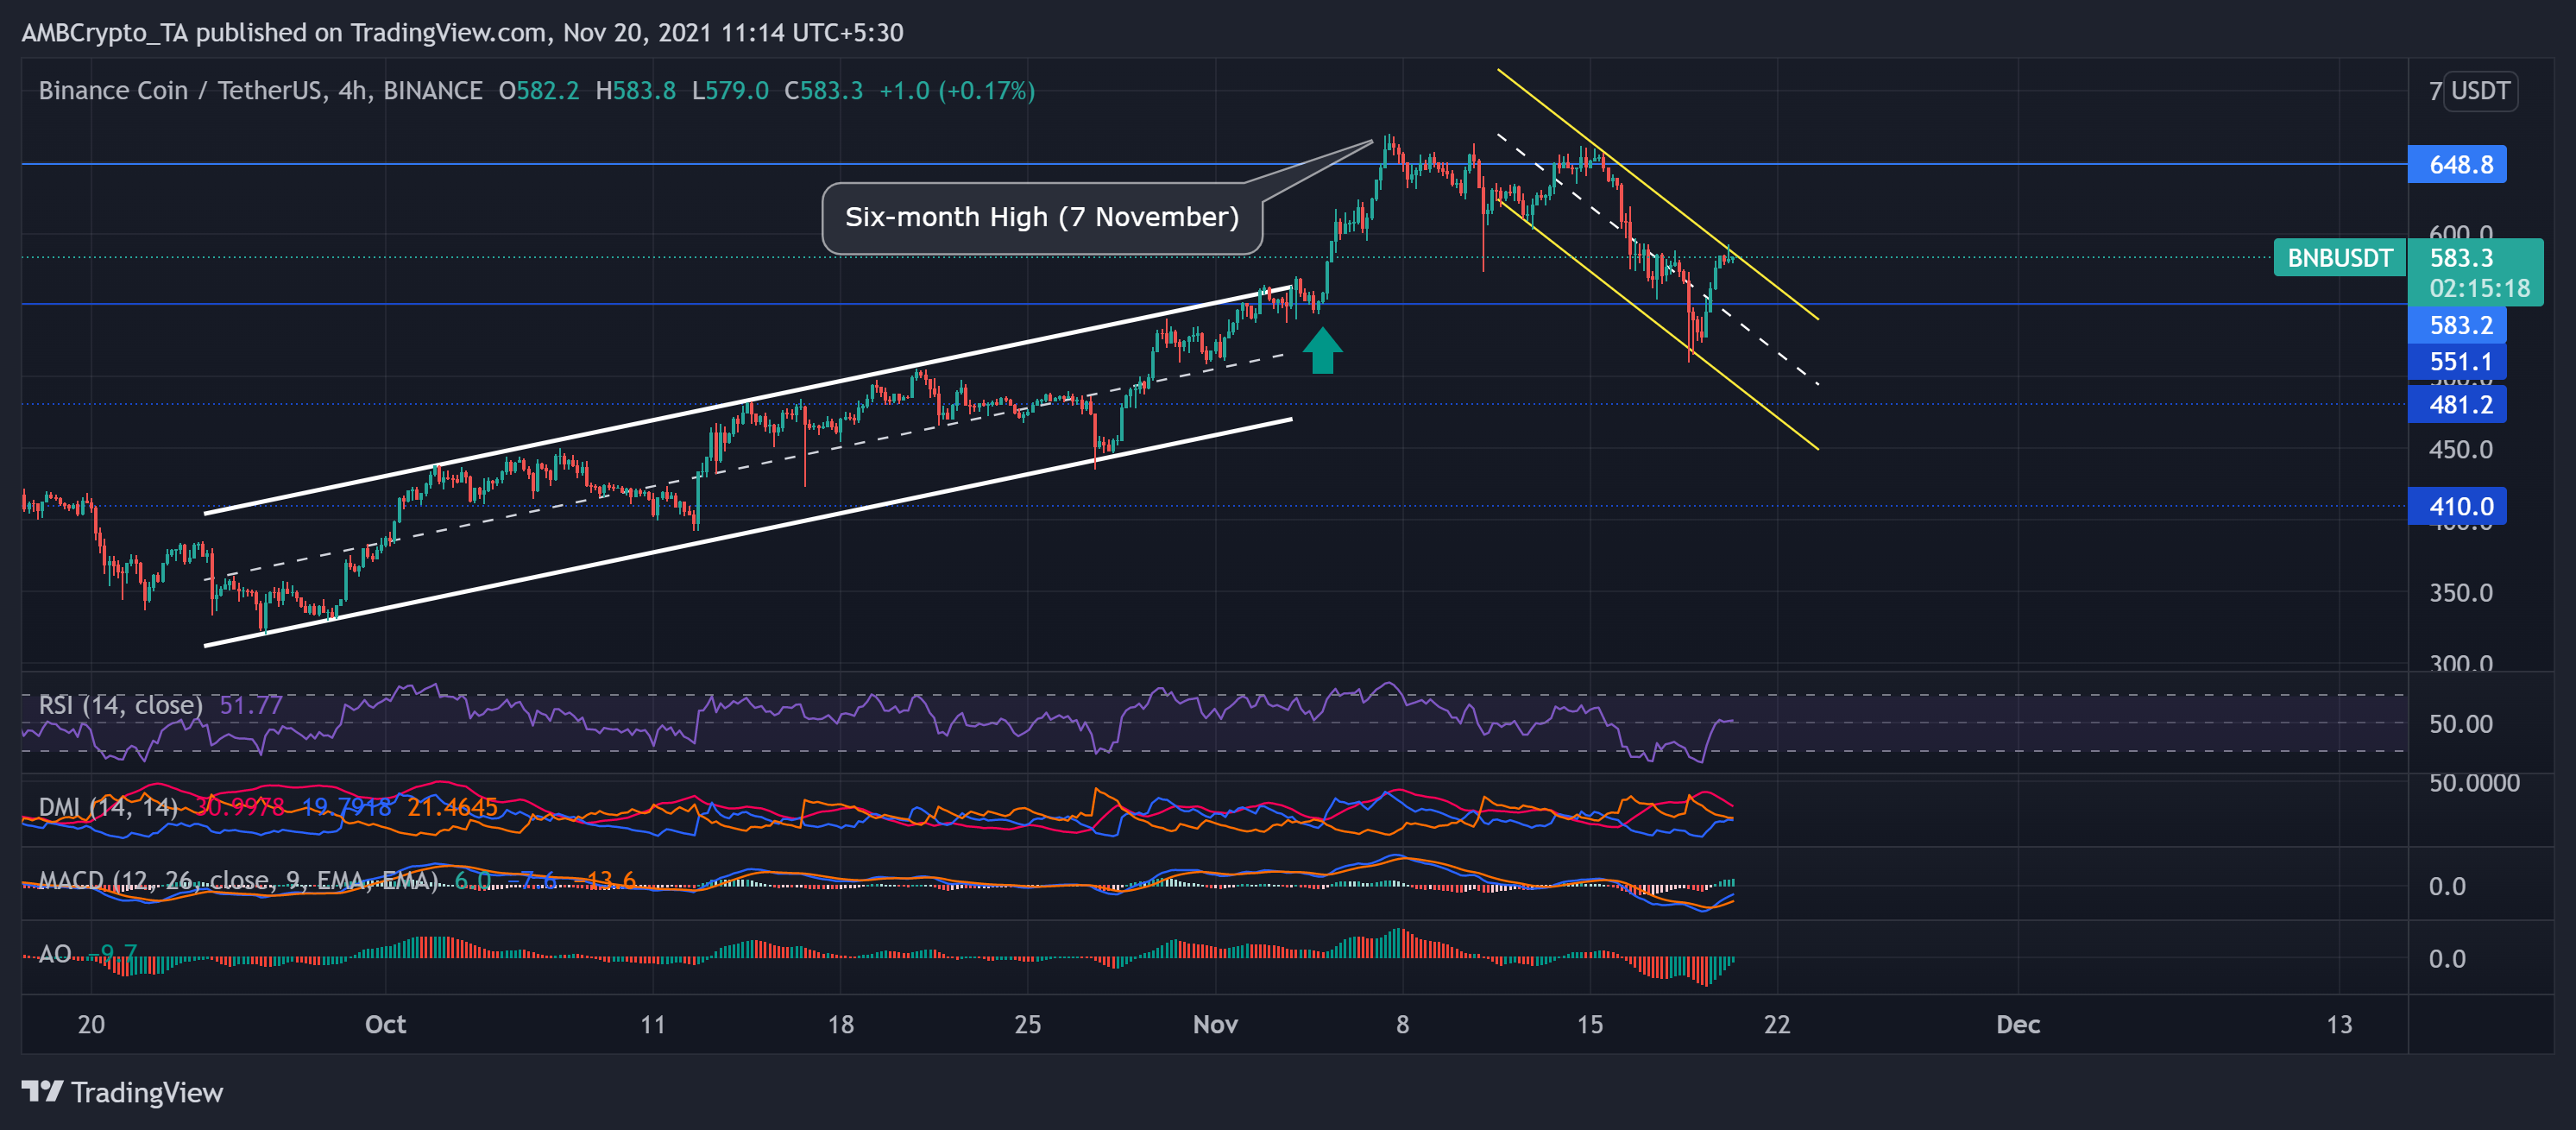
Since 24 September, BNB upturned between the two parallel lines for nearly six weeks. After a staggering 78.41% 39-day rally, the price breached the upper channel to poke its six-month high on 7 November.
However, the bears retaliated as they historically showed resistance at the $648-mark. The price action retracted in a down channel (yellow) by 22.8% until it touched its two-week low on 18 November.
The bears displayed their strength as they snapped the $551-mark. However, the bulls were keen on maintaining the $551-mark as the support level. Accordingly, the altcoin noted an 8.8% gain in 24 hours. At press time, BNB traded at $583.3.
The RSI saw an enormous 30 point surge from the oversold region to the midline. Now, however, it flashed neutral sentiments. While the DMI showed a slight bearish preference, MACD and AO visibly pointed at increasing bullish power.
Solana (SOL)
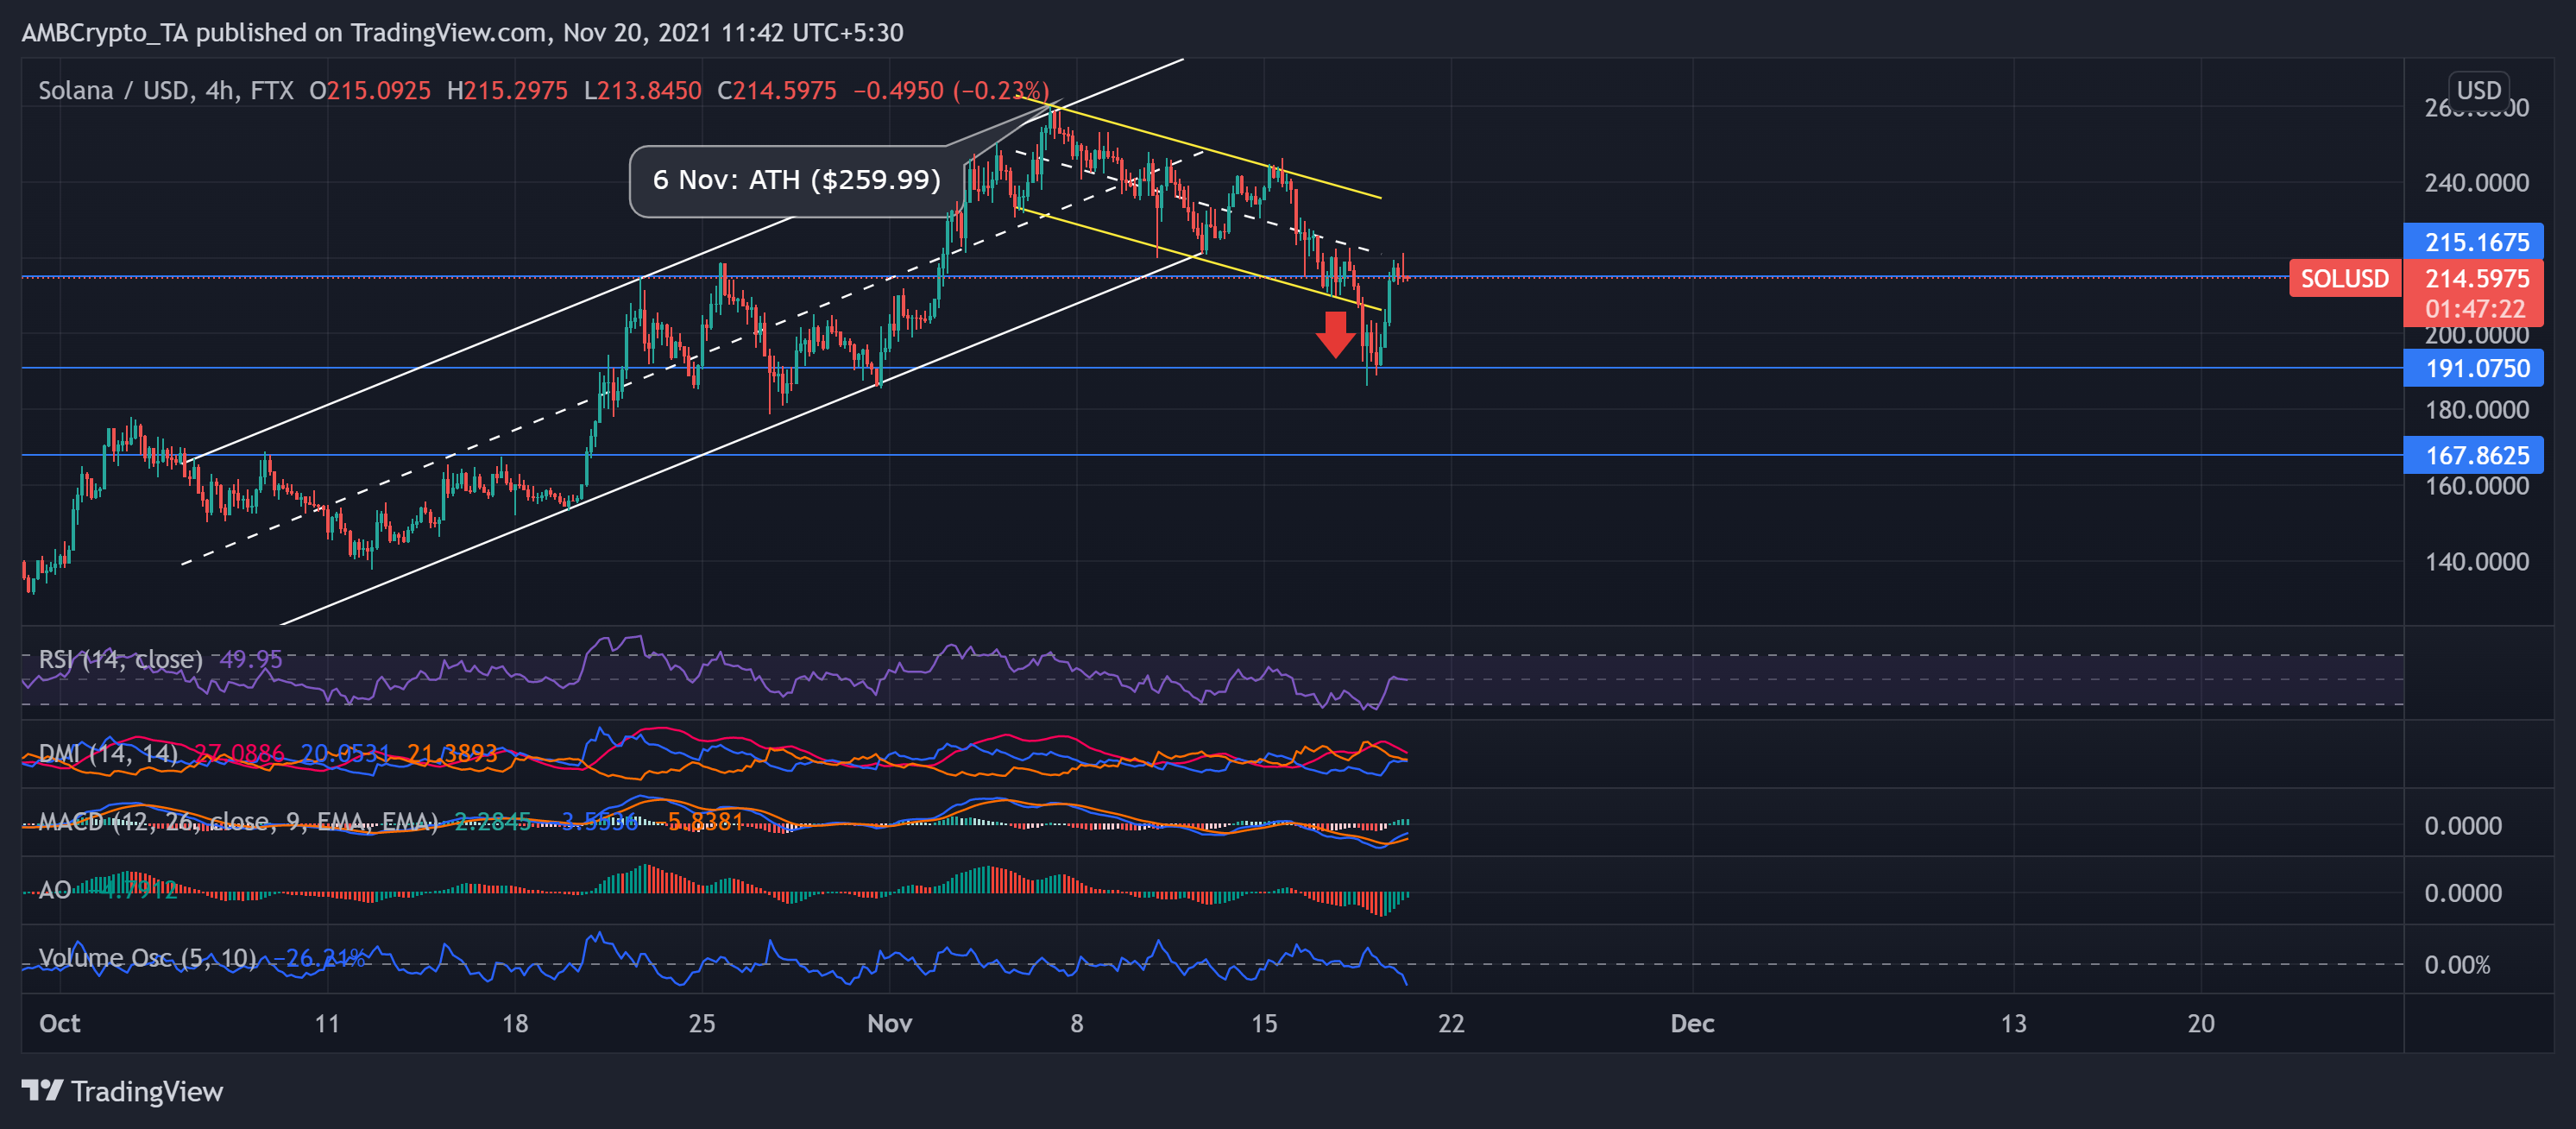
SOL recorded an enormous 85% ROI from 12 October until it struck its ATH on 6 November. However, since then, SOL withdrew as the price descended between parallel channels (yellow). Since 6 November, it noted an 18.9% decline and breached the northern trend.
This downfall led to the price action touching its nearly three-week low on 18 November. Further, the bulls even failed to show resistance at the $215-mark as bears displayed sustained pressure. However, At press time, SOL traded at $214.5975 after witnessing over 14% gains in two days. The RSI surged by 23 points in 24 hours and showed neutral signs.
While the DMI showed a slight bearish preference, MACD and AO visibly pointed at increasing bullish power. However, the revival was on decreasing trading volumes, indicating a weak bullish move.
Fantom (FTM)
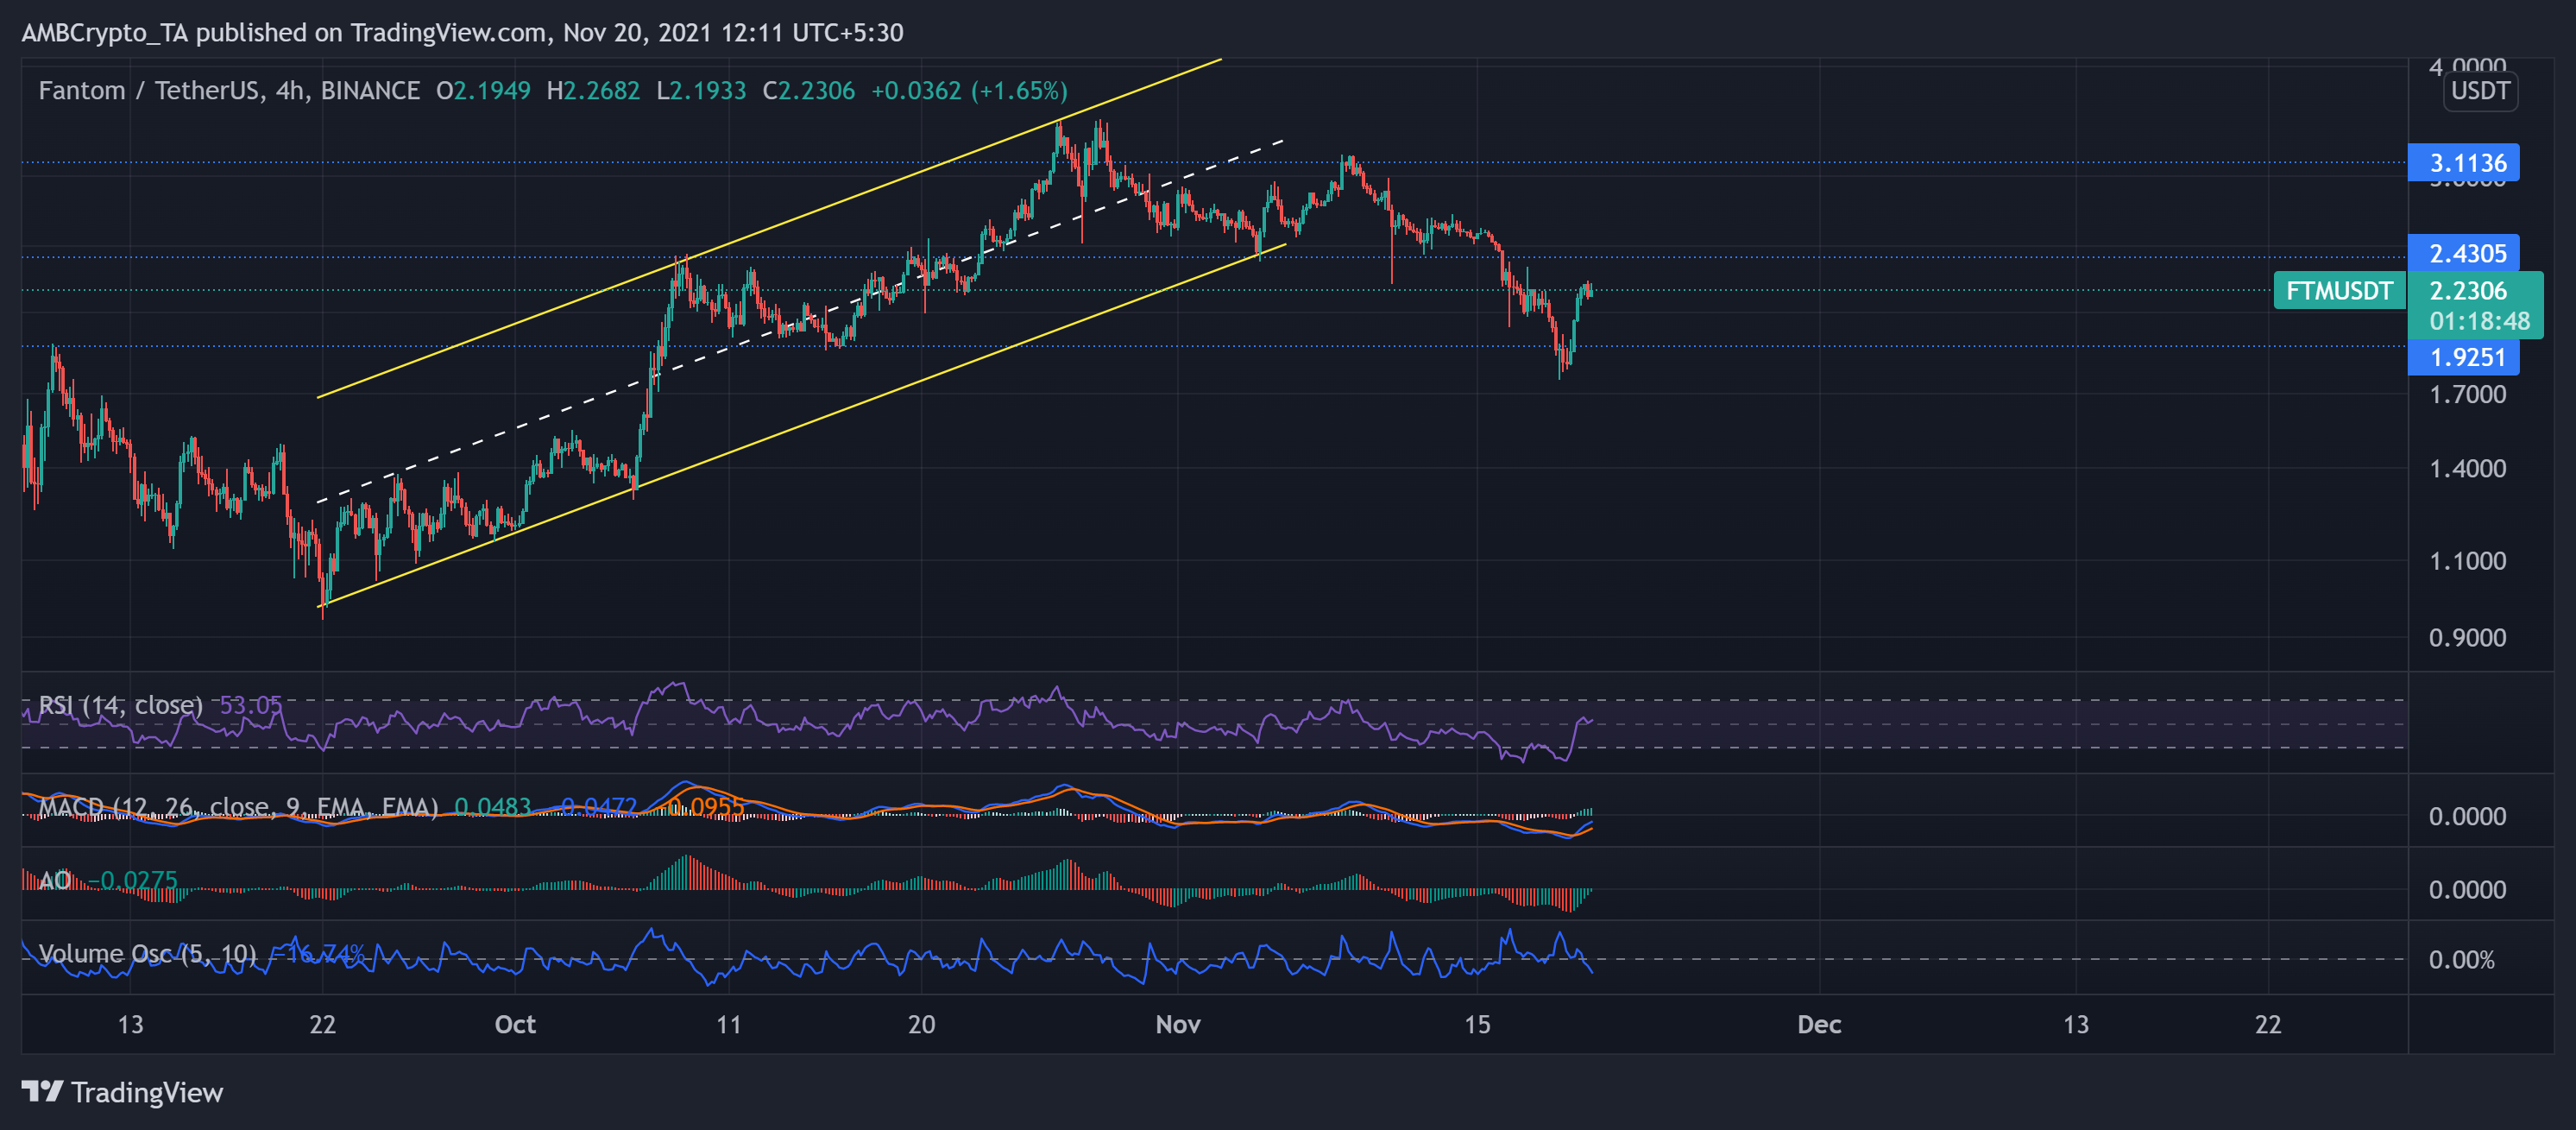
Since 21 September, the FTM price action undertook a bullish trajectory as the price bounced between the two parallel lines heading north. The digital currency noted a monstrous 186.65% ROI from 22 September to 28 October.
Consequently, FTM reached its ATH on 28 October and bounced back between the parallel lines to follow the trend. However, the altcoin lost nearly half of its value over the next three weeks. Thus, it touched its three-week low on 18 November.
Nevertheless, at press time, FTM traded at $2.23 after noting a 14.01% gain in just 24 hours. The RSI was northbound after surging 34 points over the last day. Additionally, MACD and AO visibly pointed at increasing bullish power. However, the revival was on decreasing trading volumes, indicating a weak bullish move.


![dogwifhat's [WIF] 3-day rally has eyes glued, yet a hidden risk lurks](https://ambcrypto.com/wp-content/uploads/2025/04/Gladys-8-400x240.jpg)