The ‘right time’ for Fantom’s next rally is just round the corner

Shattering records has sort of become routine for Fantom at this point. As highlighted recently, this alt has appreciated by more than 7000% since the beginning of this year. Unlike the astronomical surges of other coins, FTM’s surge has largely been organic and supported by fundamentals.
The TVL locked on this DeFi platform has grown the most since September when compared to the likes of Avalanche, Solana, Tron, Ethereum or Polygon.
FTM’s price did react positively initially, rallied to a fair extent, but ended up slowing down on 9 November. In fact, it has been depreciating in value since then. So, is the coin just waiting for the “right time” to react or continue pumping, or has it stepped into its bearish phase already?
Time to re-shine
Unlike the rest of the market’s coin’s, Fantom’s correlation with Bitcoin has not been that strong. Until 17 November, this coin shared a negative correlation, and even at the time of writing, this number was barely in the positive territory. What this means is that until Bitcoin’s prospects get better, Fantom does have some time to shine.
Interestingly, key metrics were in favor of the aforementioned narrative. The supply on exchanges was at is local peak towards the end of October. The same started depleting in November and has been able to keep with with that trend until now.
This, to a fair extent, highlights the demand of FTM tokens and their movement into private wallets.

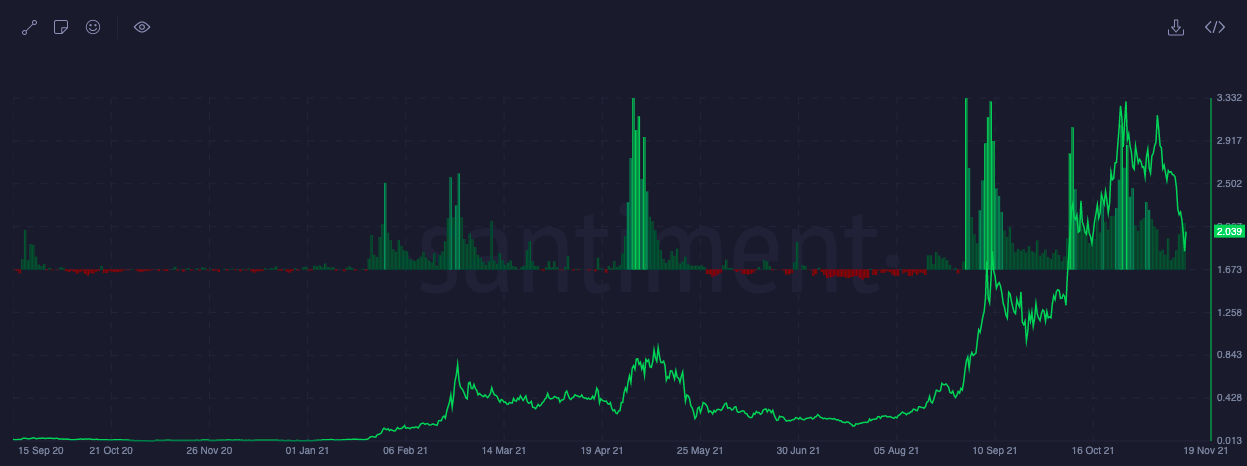
The asset’s Price DAA Divergence has also been projecting bullish streaks on its chart. In fact, the intensity of bullishness managed to increase from 13 November’s 111% to close to 551% at the time of analysis.
This metric tracks the relationship between the alt’s price and the number of daily active addresses interacting with it. Now, the current projection underlines the sound state of the daily active addresses and the network activity.
Positivity returning
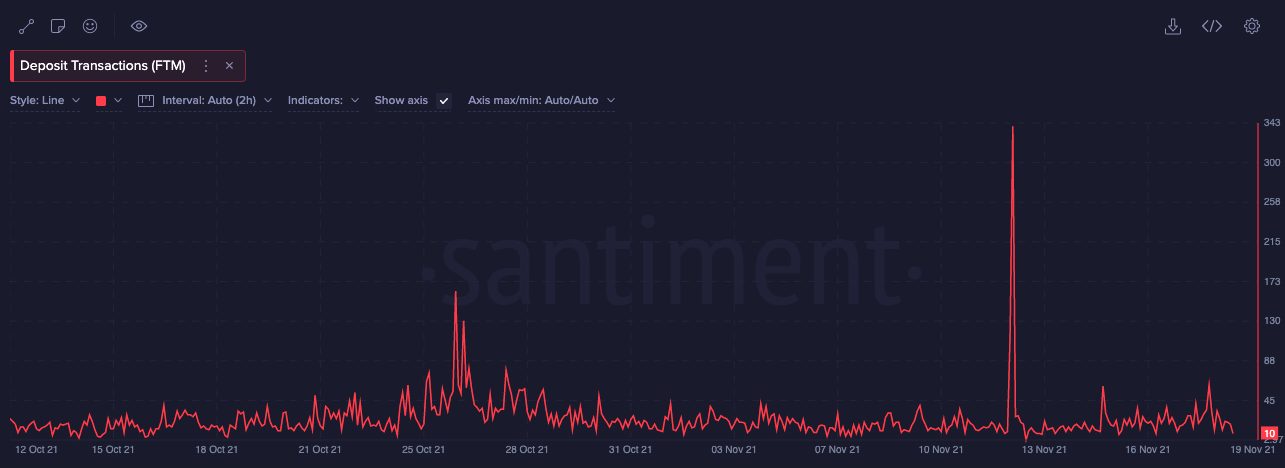
Fantom’s deposit transactions have also managed to return back to its usual levels, post 13 November’s spike. This metric highlights all the incoming and outgoing transactions involving token deposits addresses daily.
Spikes usually indicate a hike in short-term trading pressure, while movement towards the low-side indicate the absence of sell pressure. Thus, it can be said that HODLers wouldn’t abandon their tokens, as such, at this stage.
The buying bias was further re-asserted by the state of the trades per side metric. As per data from ITB, the buy-sell difference over the past 12 reflected a positive value of 2.3 million tokens, implying that buy trades were leading the proceedings.
In light of the aforementioned projections it can be concluded that Fantom’s “right time” to pump again is just round the corner.


