Binance Coin, VeChain, Ethereum Classic Price Analysis: 30 December

The broader market still struggled to initiate a swift bullish rally. Consequently, altcoins like Binance Coin, Vechain, and Ethereum Classic stayed below their 20-50-200 SMA. Now, the RSI of all these cryptos attempted a retrieval from the oversold region.
Binance Coin (BNB)
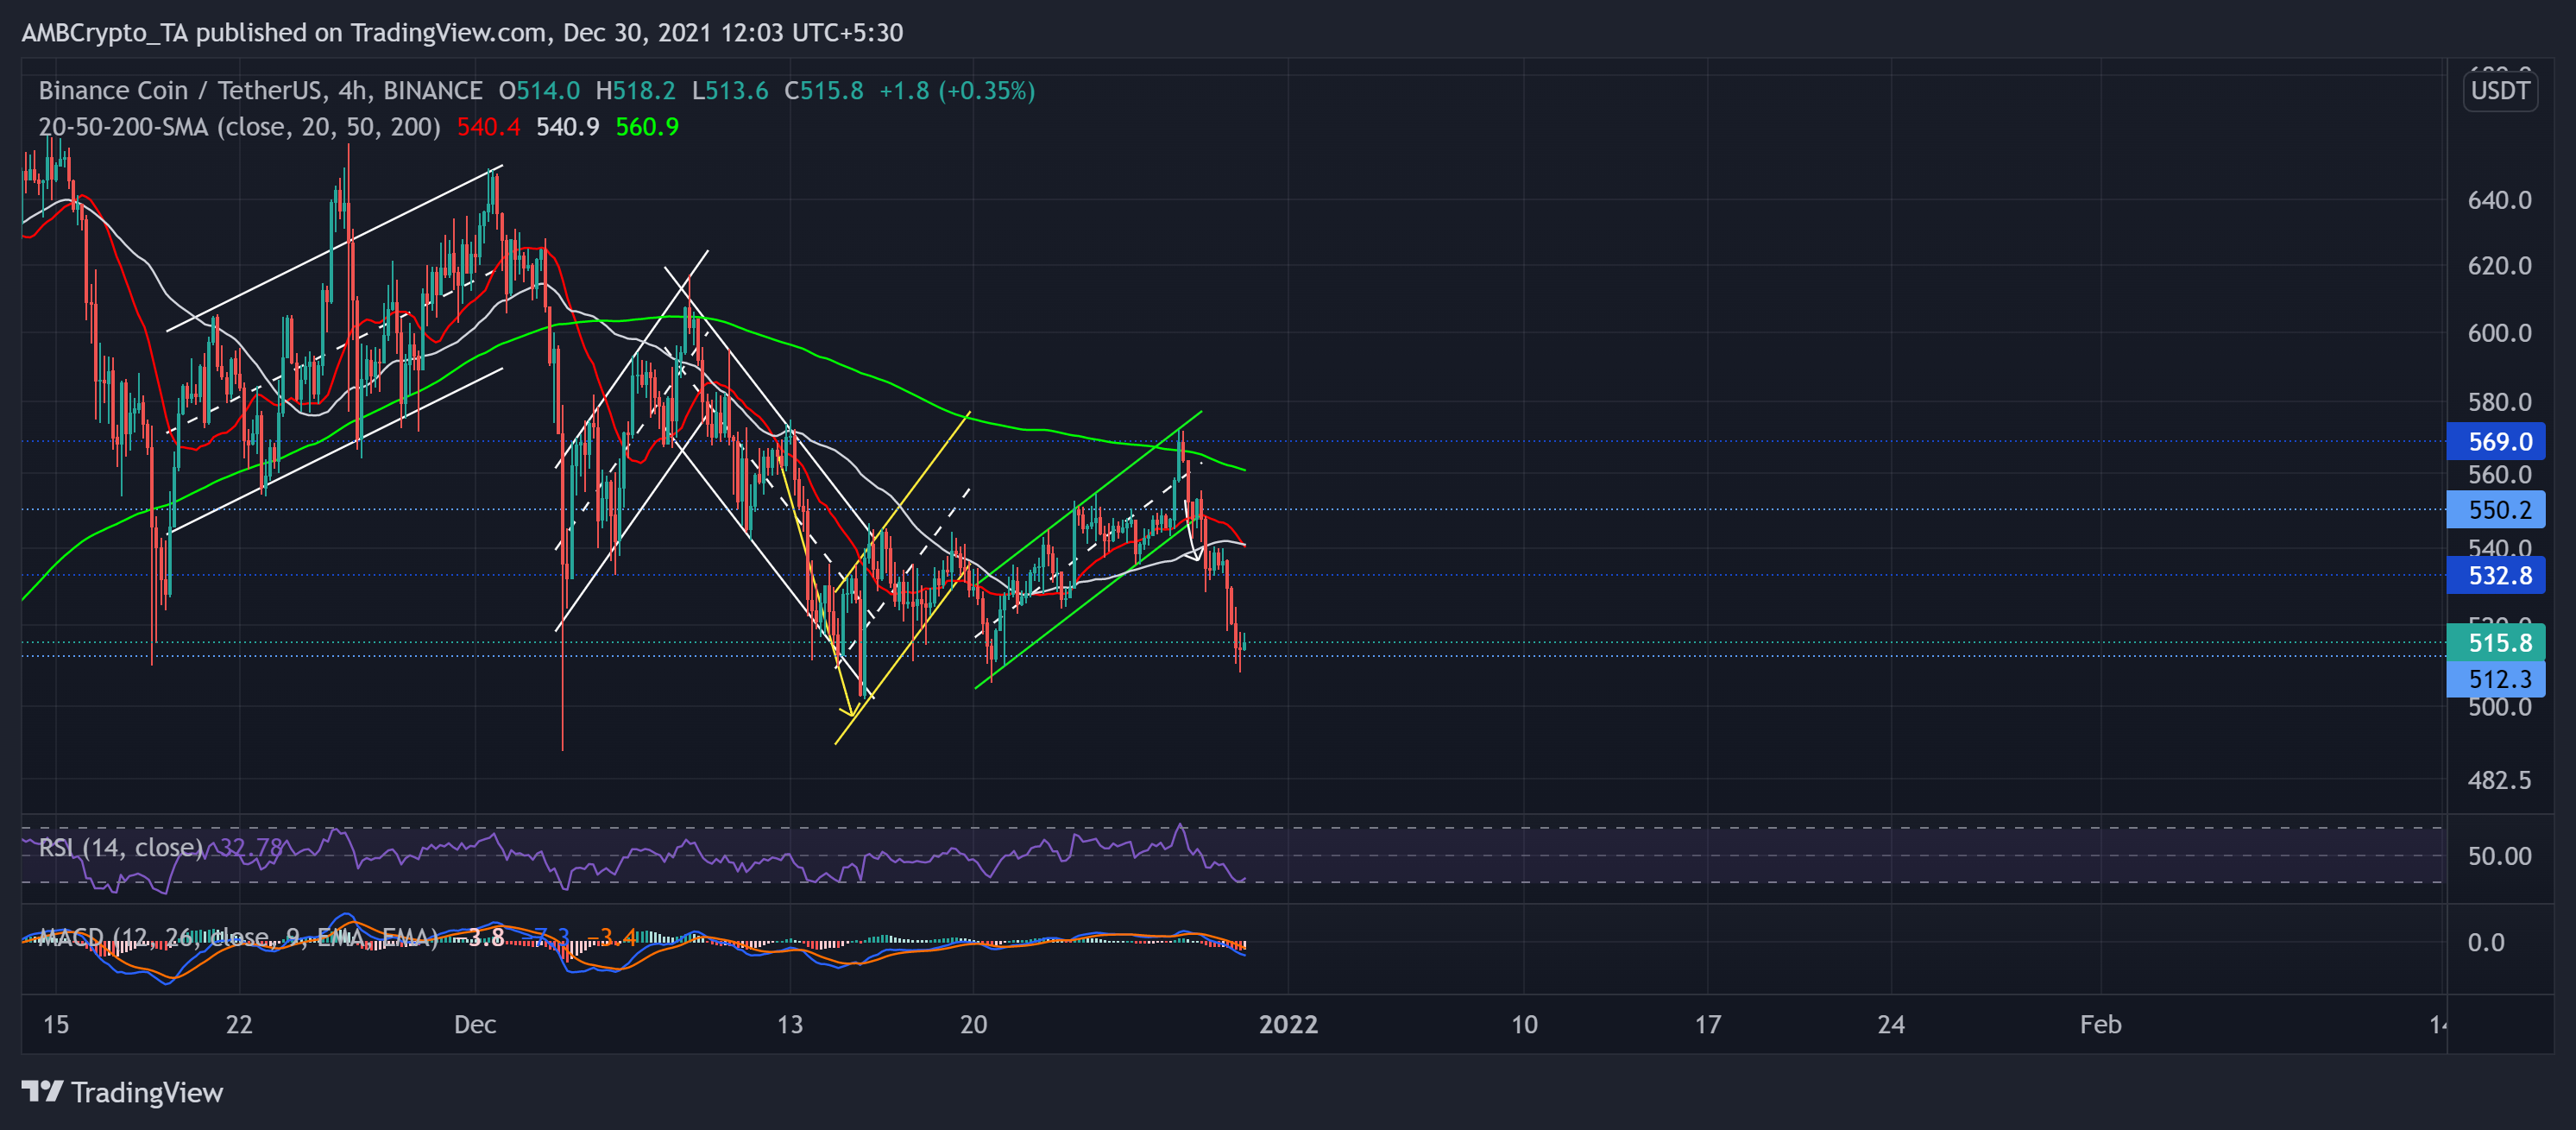
After a bearish flag (yellow) breakdown, the price action found support at the $512-level for nine weeks now. Thus, BNB saw a 12.55% recovery (since 20 December low) in an ascending channel (green) until it poked its two-week high on 27 December.
For the past three weeks, the $560-mark acted as a resilient testing level for the bulls. Coupling that along with the broader sell-off propelled a 9.94% retracement over the past three days.
At press time, BNB traded below its 20-50-200 SMA at $515.8. The RSI stood at the 32-mark but visibly flashed revival signs. The MACD lines and histogram confirmed the bearish vigor. But a light red bar at the end gave some hope for a possible recovery. Now, the alt almost seemed to be rangebound between the $569 and $512-level as the bulls strived to test the $532 hurdle.
VeChain (VET)

Over the past ten days, VET finally snapped off its long-term bearish trend resistance (since 9 November, white) while ensuring the five-month support at $0.076-mark.
This retrieval attempt market a rising wedge (green, reversal pattern) on its 4-hour chart. However, the price action found $0.100-mark as resistance since the beginning of this month.
As a result, it saw a 20.37% breakdown from 27 to 30 December. Over the past few hours, the VET saw a strong reversal from the $0.08157-mark.
At press time, the alt traded at $0.08374. The RSI saw a pullback from the oversold region while showing some retrieval signs. The EMA ribbons seemed to make a bearish flip yet again while the immediate resistance could be near the 20 EMA (dark yellow).
Ethereum Classic (ETC)
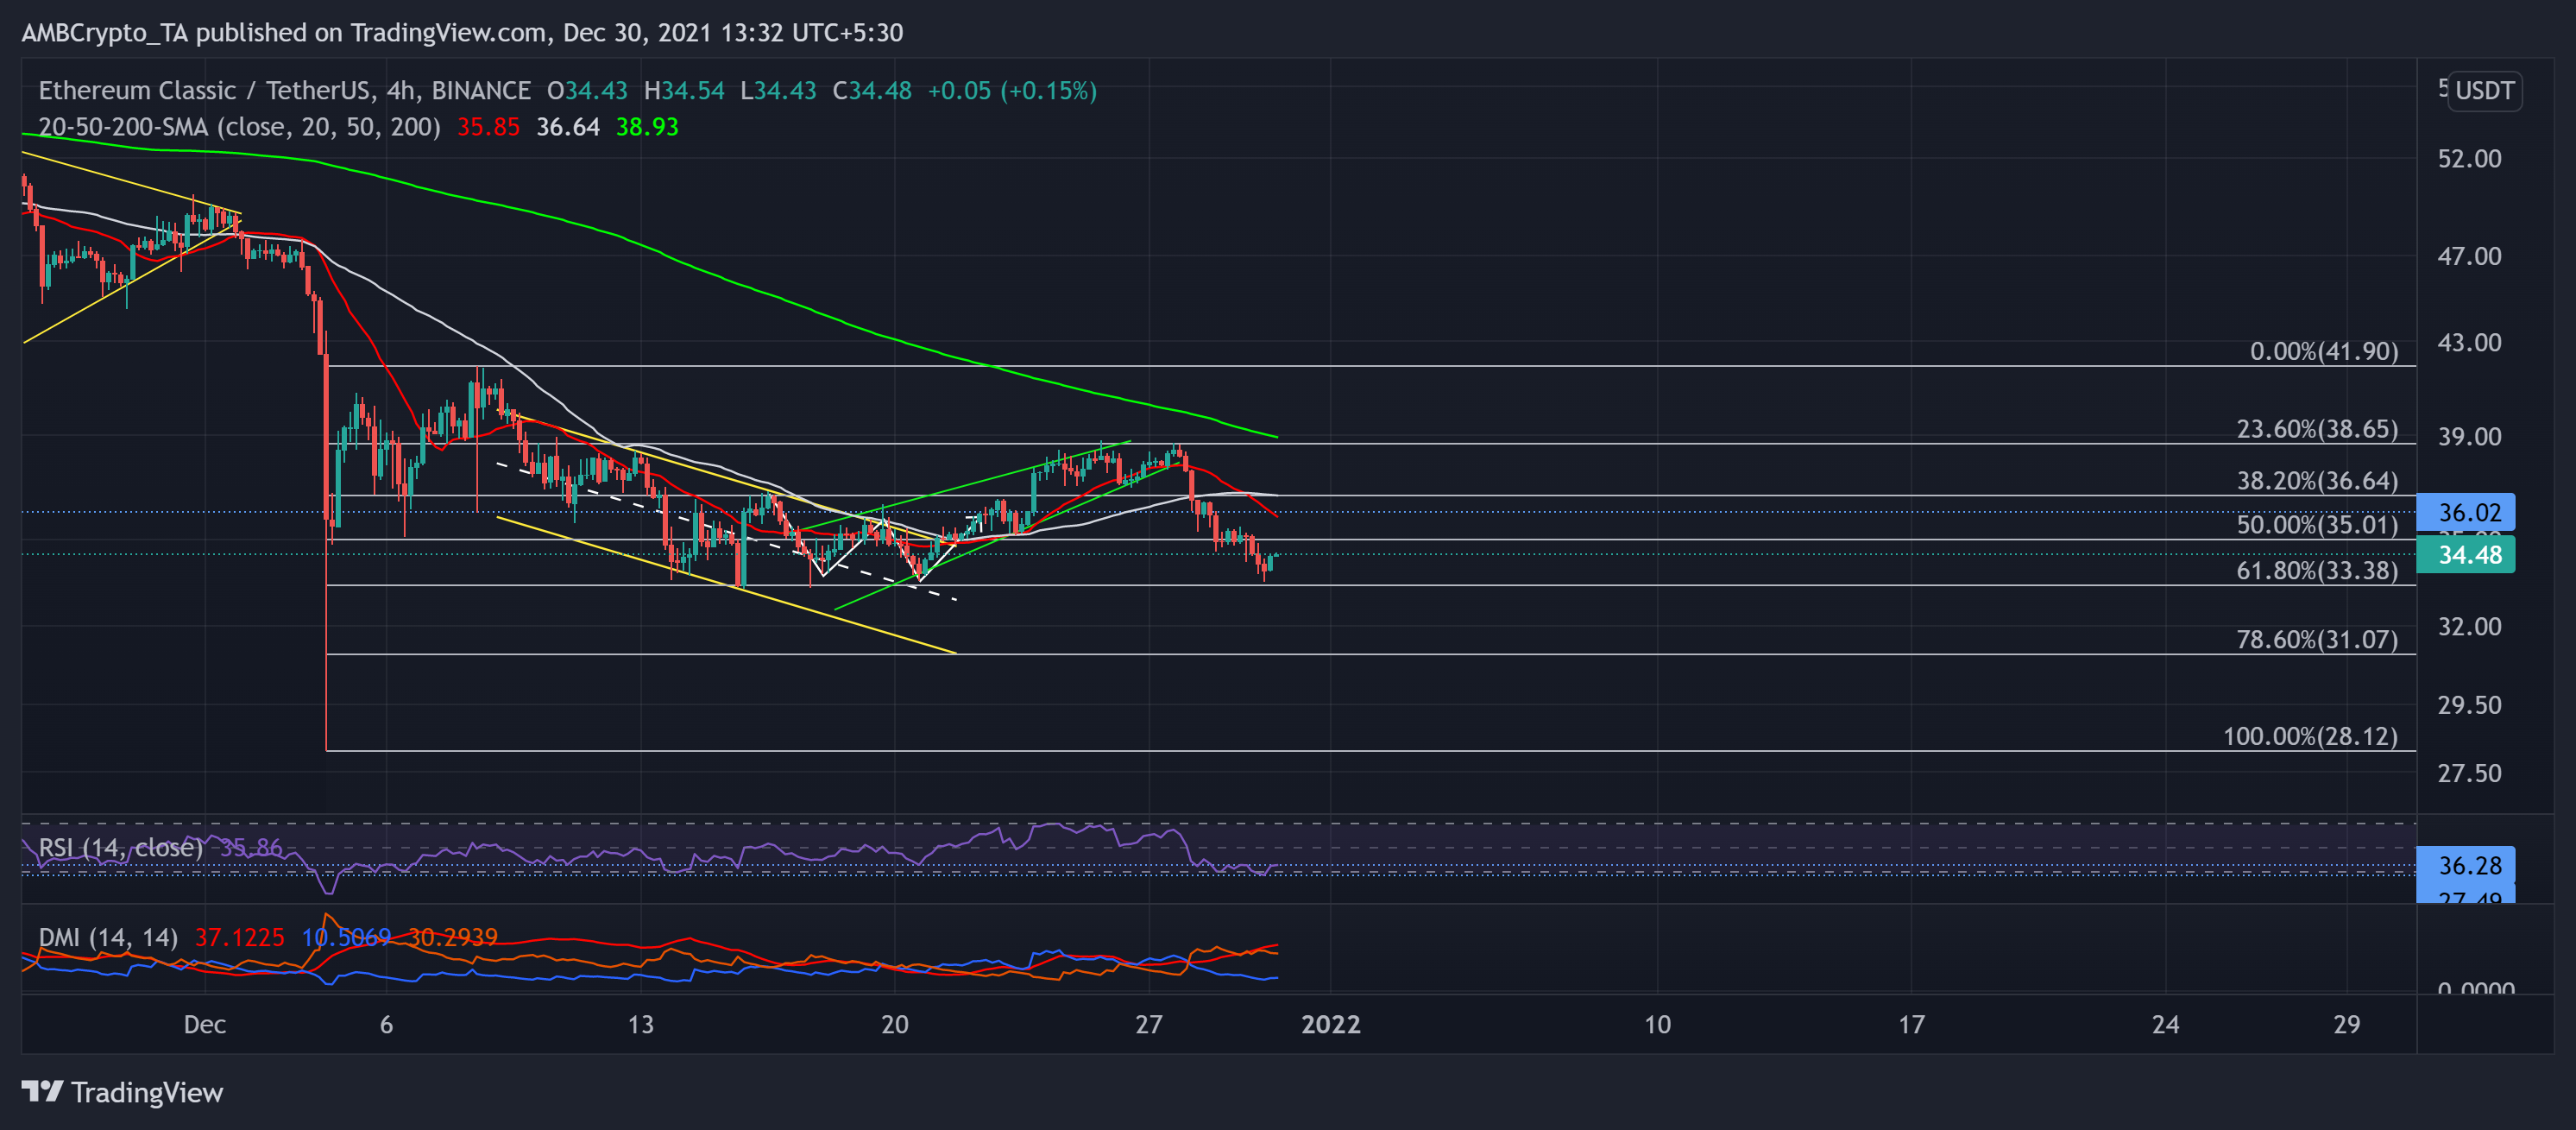
After being on an aggressive downturn, ETC finally seemed to find a range between $33.38 and $38.65 for the last three weeks. The 61.8% golden Fibonacci level stood strong while the bulls retested the upper channel (yellow) thrice before breaking out as the price swayed above the midline (dashed, white).
Over the past few days, it witnessed a rising wedge (green) breakdown from the $38-level and plummeted below its 20-50-200 SMA. Now, the bulls may find a retesting level at the 20-SMA (red) at the $36-mark.
At press time, ETC traded at $34.38. The RSI was in a downtrend and poked its one-month low on 30 December. However, it needed to cross the 36-mark to confirm a strong comeback. Further, the DMI suggested a bearish preference without discarding a bullish revival possibility.


