Binance Coin’s [BNB] breakdown beneath $300 means traders can prepare for…
![Binance Coin's [BNB] breakdown beneath $300 means traders can prepare for...](https://ambcrypto.com/wp-content/uploads/2023/02/PP-1-BNB-cover-1-e1676361085319.jpg)
Disclaimer: The information presented does not constitute financial, investment, trading, or other types of advice and is solely the writer’s opinion.
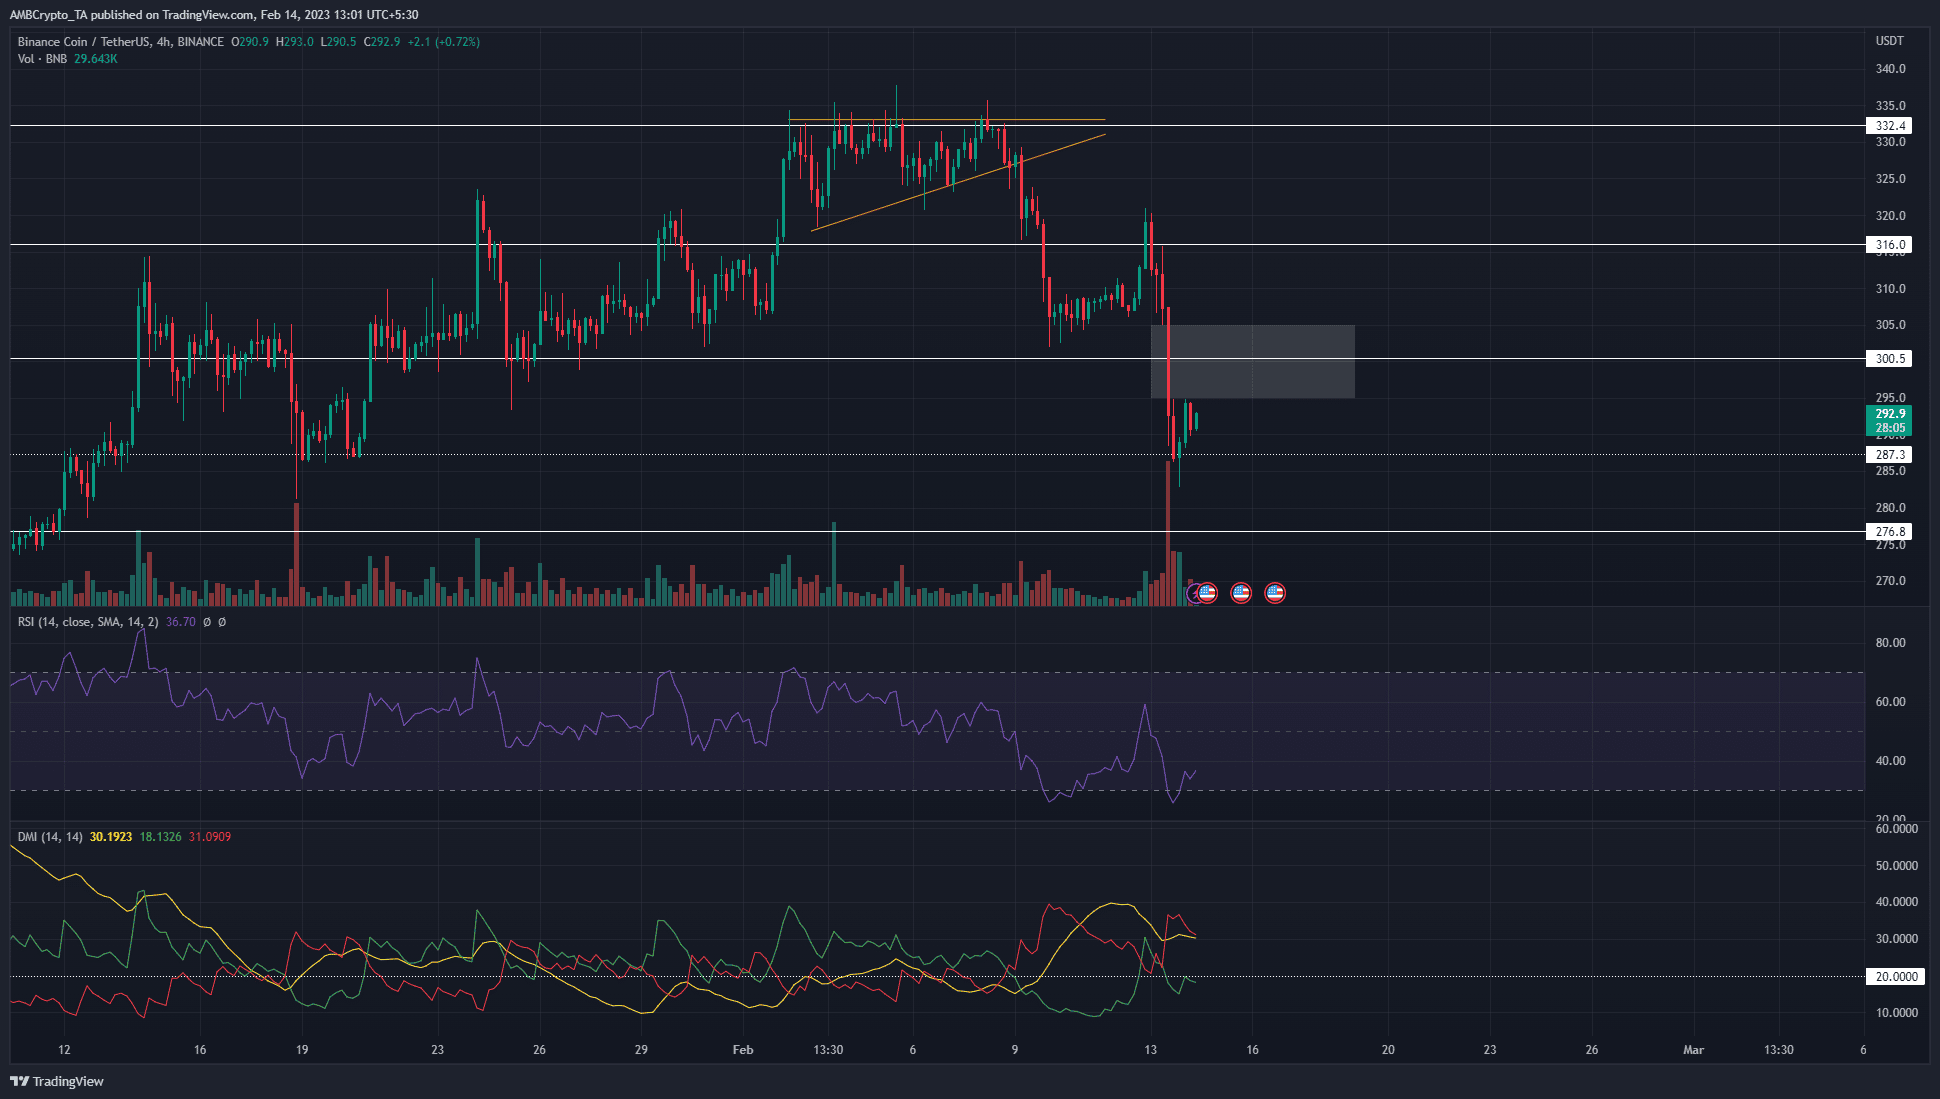
- The H4 market structure of BNB was flipped to bearish and $320 retested as support.
- The $305 mark could be the next level to monitor.
The uncertainty around Binance USD [BUSD] continued after Paxos, a partner of Binance, was ordered to stop minting the token. This came from the New York Department of Financial Services and sparked panic among investors.
How much are 1, 10, 100 BNB worth today?
Binance Coin [BNB] also saw selling pressure mount in recent days. The news surrounding Paxos and BUSD affected the sentiment behind the exchange token of Binance. Technical analysis showed that further losses were likely.
An inefficiency near $300 meant a retest could spark the next leg down
The recent sell-off saw BNB crash beneath $300. In the past few hours of trading, the price witnessed a bounce from $287. This level had previously served as support on 20 January, before Binance Coin’s push toward $315 and higher.
The failure to break out past the ascending triangle warned traders that a downturn was imminent. The plunge beneath $320 happened on 9 February. On 13 February, the asset retested the same zone at $320 as resistance before the next leg down to $287.
The Directional Movement Index on the four-hour chart showed a strong bearish trend in progress. The -DI and the ADX lines (red and yellow respectively) were above 20. This was in agreement with the price action.
The move below $320 broke the H4 market structure and flipped it to bearish. At the time of writing, the bias remained bearish, but a fair value gap was spotted. Highlighted in white, it extended from $295 to $305.
Hence, it was likely that $300-$305 would be retested soon as resistance before another move downward. On the other hand, the bearish structure will be broken if Binance Coin can push past $320.
Is your portfolio green? Check the Binance Coin Profit Calculator
The Open Interest chart showed heavy bearish sentiment behind Binance Coin
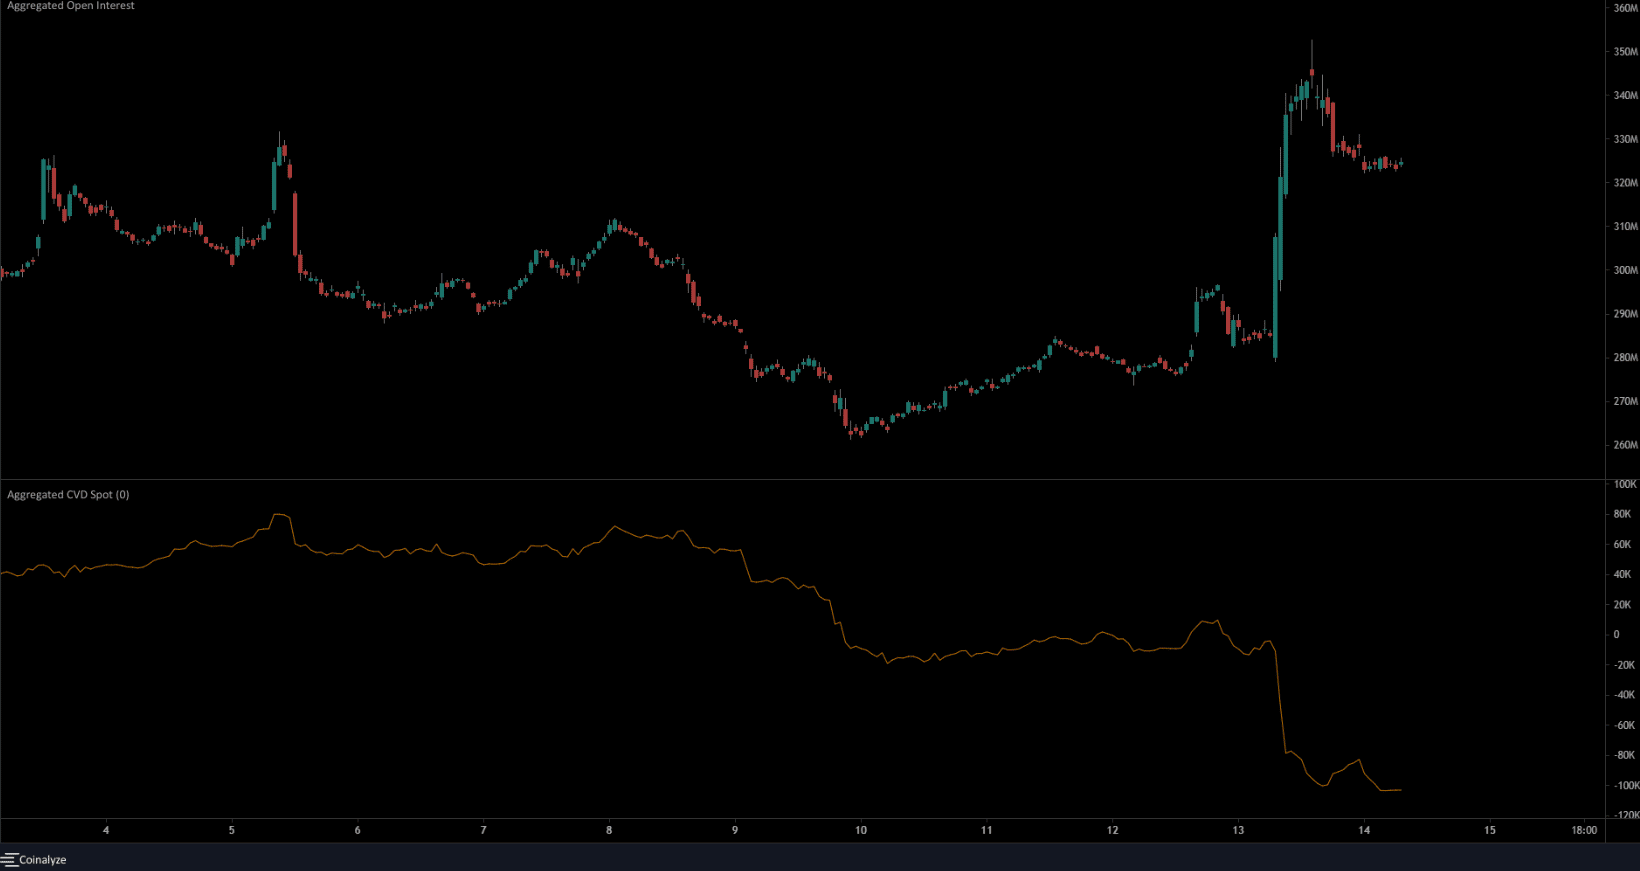
On 13 February, the price fell below the $303 mark. This level had served as support in the short term, from 9 February. Alongside the falling prices, Open Interest soared higher. This was a sign that short positions were likely opened and a large number of participants sought to profit from the falling BNB.
The spot CVD also saw a large decline in the past few days. Taken together, the inference was significant selling pressure combined with bearish market sentiment for BNB.


