
- Bitcoin’s MVRV deviation bands signaled potential profit-taking.
- UTXO price distribution revealed strong support around $90K, while resistance near $100K could determine BTC’s next move.
Bitcoin’s [BTC] price has been consolidating near the $97,000 mark, showing resilience despite minor fluctuations.
Recent on-chain data and technical indicators suggested that BTC remained in a strong position, though key resistance and support levels will determine its next move.
Bitcoin MVRV bands indicate potential upside
The MVRV (Market Value to Realized Value) Extreme Deviation Pricing Bands showed Bitcoin trading near the +1.0 band at press time, which historically signals strong price momentum.

Source: Glassnode
While BTC has briefly touched the upper deviation bands, a break above this zone could push the price towards new highs.
However, BTC might see a short-term correction toward the mean pricing level if rejection occurs.
Also, the current level means that BTC’s strongest support level for now is around the $93,000 price level.
UTXO highlights key support zones
The UTXO Realized Price Distribution (URPD) chart indicated that a significant volume of BTC transactions have occurred between $90,000 and $101,000.
The concentration of transactions in these price zones suggests strong support, making BTC less likely to drop below $90,000 without substantial selling pressure.
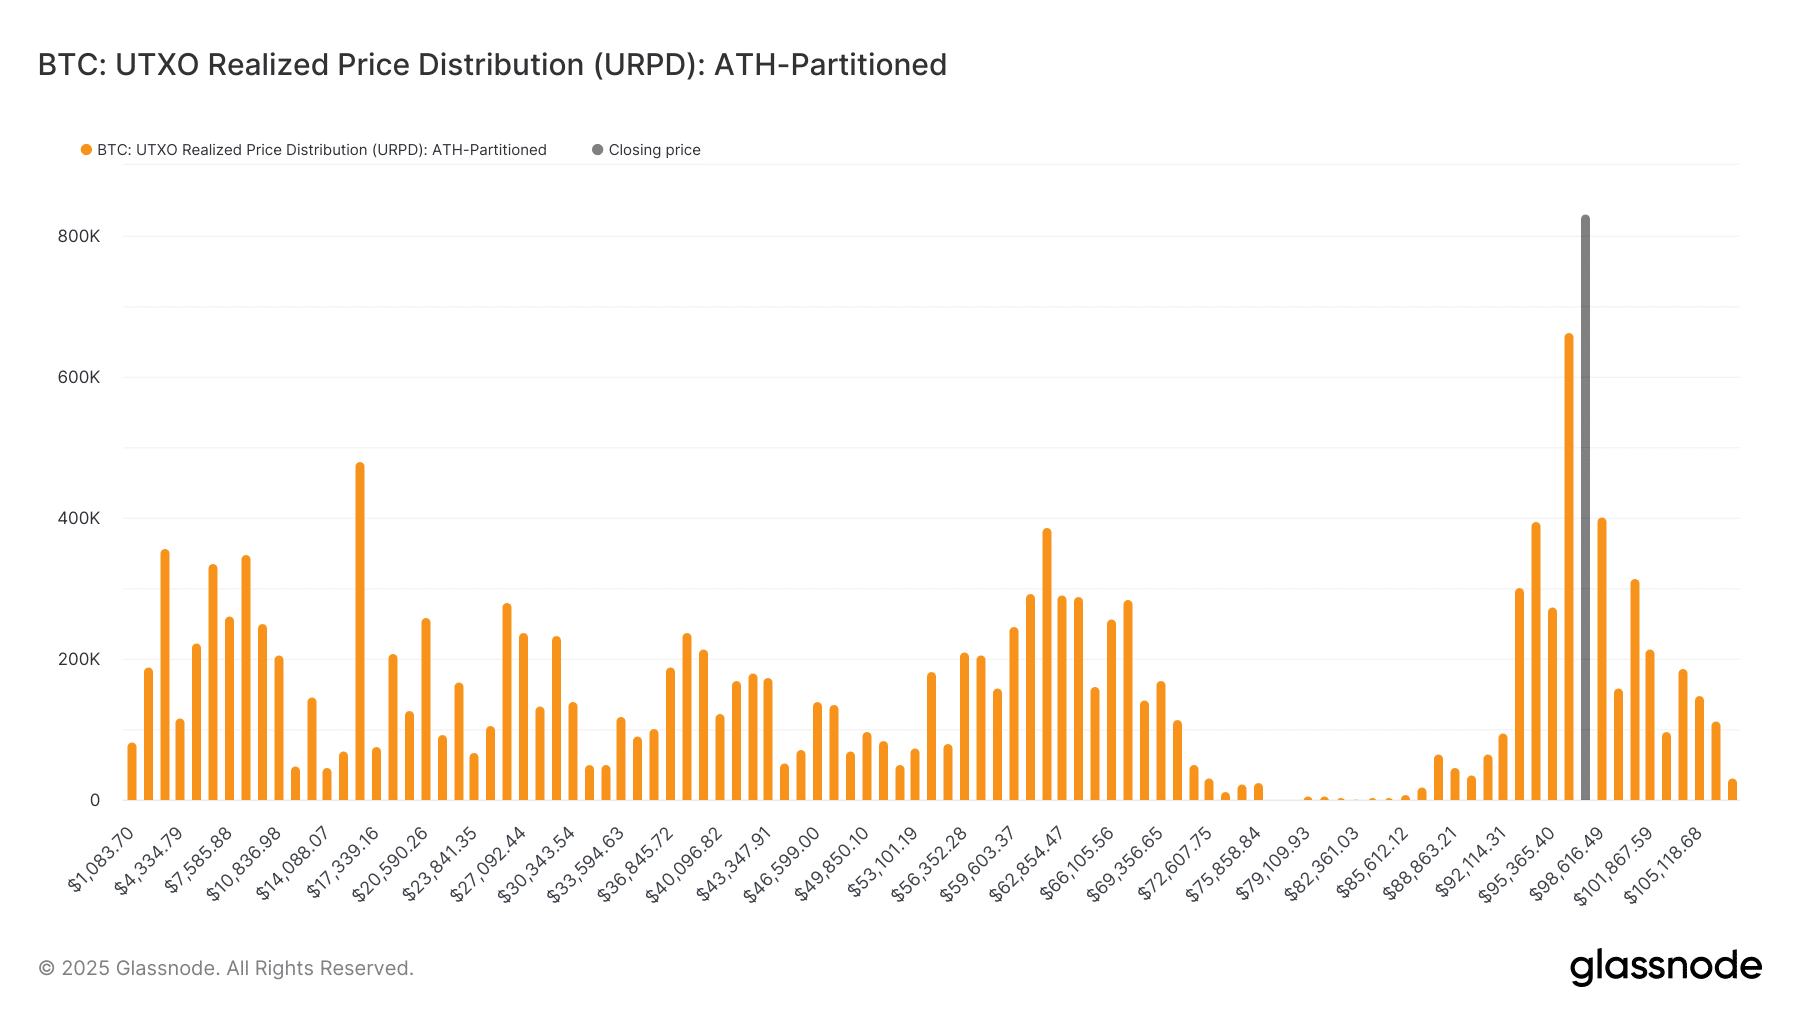
Source: Glassnode
Conversely, the distribution also shows resistance forming above the $101,000 mark, meaning Bitcoin will need strong bullish momentum to break higher.
BTC technical indicators signal cautious optimism
From a technical standpoint, Bitcoin’s price action remains steady, trading slightly below the 50-day moving average of $98,801 as of this writing.
The 200-day moving average was at $80,021, providing a strong long-term support base.
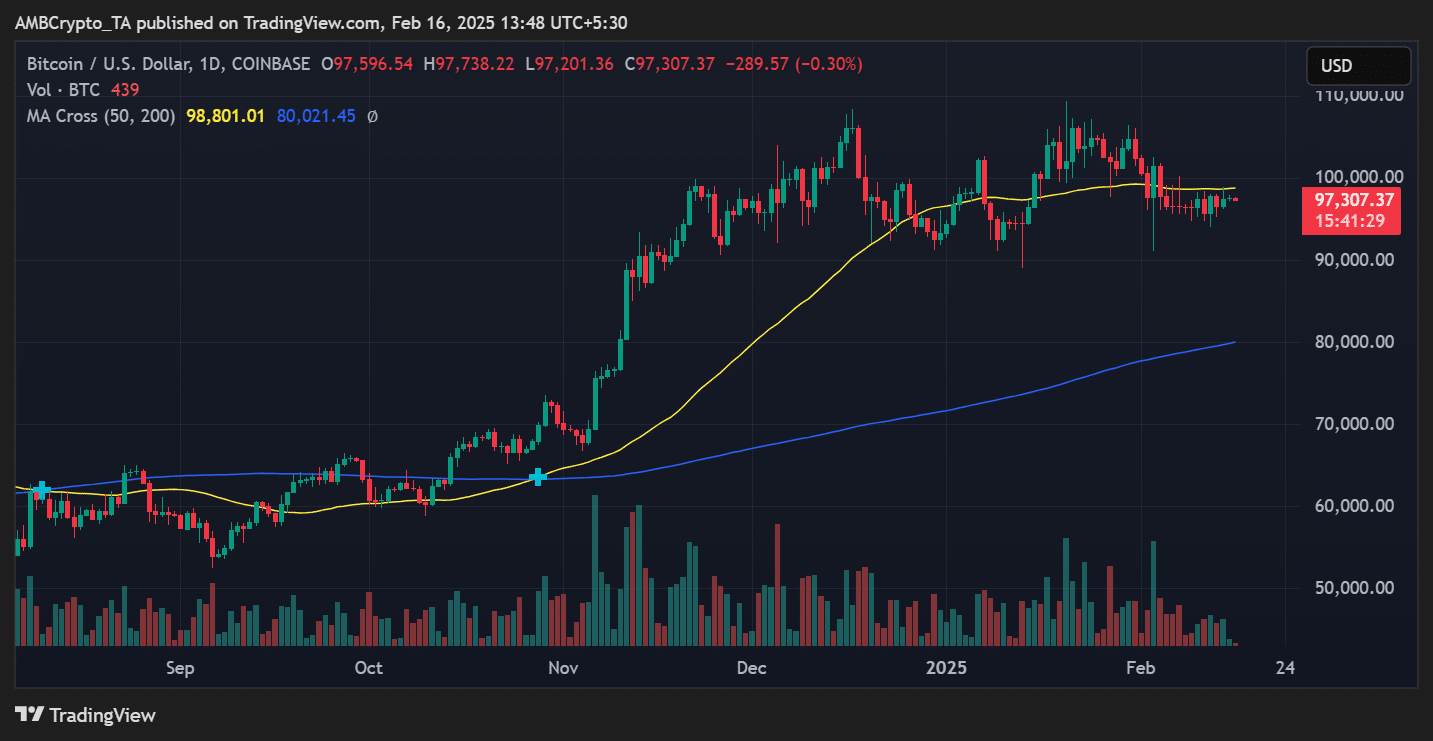
Source: TradingView
While the current price was facing resistance, the bullish structure remained intact, suggesting that Bitcoin could attempt another leg up if buyers regain control.
A critical phase for Bitcoin’s price action
Bitcoin’s current market positioning presents both opportunities and risks. The MVRV bands suggest a potential for further upside, while the UTXO realized price distribution highlights key support and resistance levels.
A break above $101,000 could open doors to higher valuations, while a failure to hold support at $90,000 might trigger short-term bearish sentiment.
Traders should watch these levels closely as Bitcoin enters a decisive phase.