
- Bitcoin formed a smaller range within the range.
- Bullish conviction has weakened considerably, and selling pressure could soon dominate.
Bitcoin [BTC] continued to trade between $73k and $60.7k, forming a range.
In an earlier analysis, AMBCrypto had reported that bulls need to defend the $64.5k support zone to push above the $66k resistance.
This did not occur, instead, we saw a rejection at $67k and a move to $62.8k. This development came at a time when whale activity and ETF inflows were both slowing down.
Therefore, an argument for continued short-term consolidation was valid.
The larger-picture metrics that fueled BTC growth have declined
In a post on X (formerly Twitter), crypto analyst Whale Panda noted that Bitcoin ETF flows were negative for the third consecutive day on Friday the 26th of April.
Blackrock’s ETF IBIT saw a third day of zero inflows after receiving the largest inflows earlier this month.
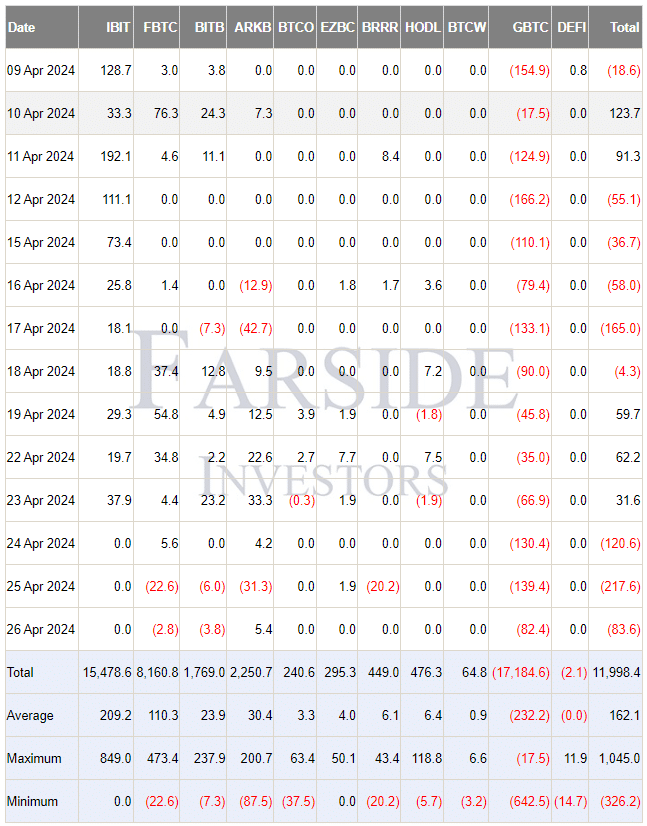
Source: Farside Investors
A lack of demand is visible here. Only Grayscale Bitcoin ETF (GBTC) saw consistent outflows, but some others such as ARKB joined it on the 25th of April.
This was a reflection of the lack of bullish conviction after the halving.
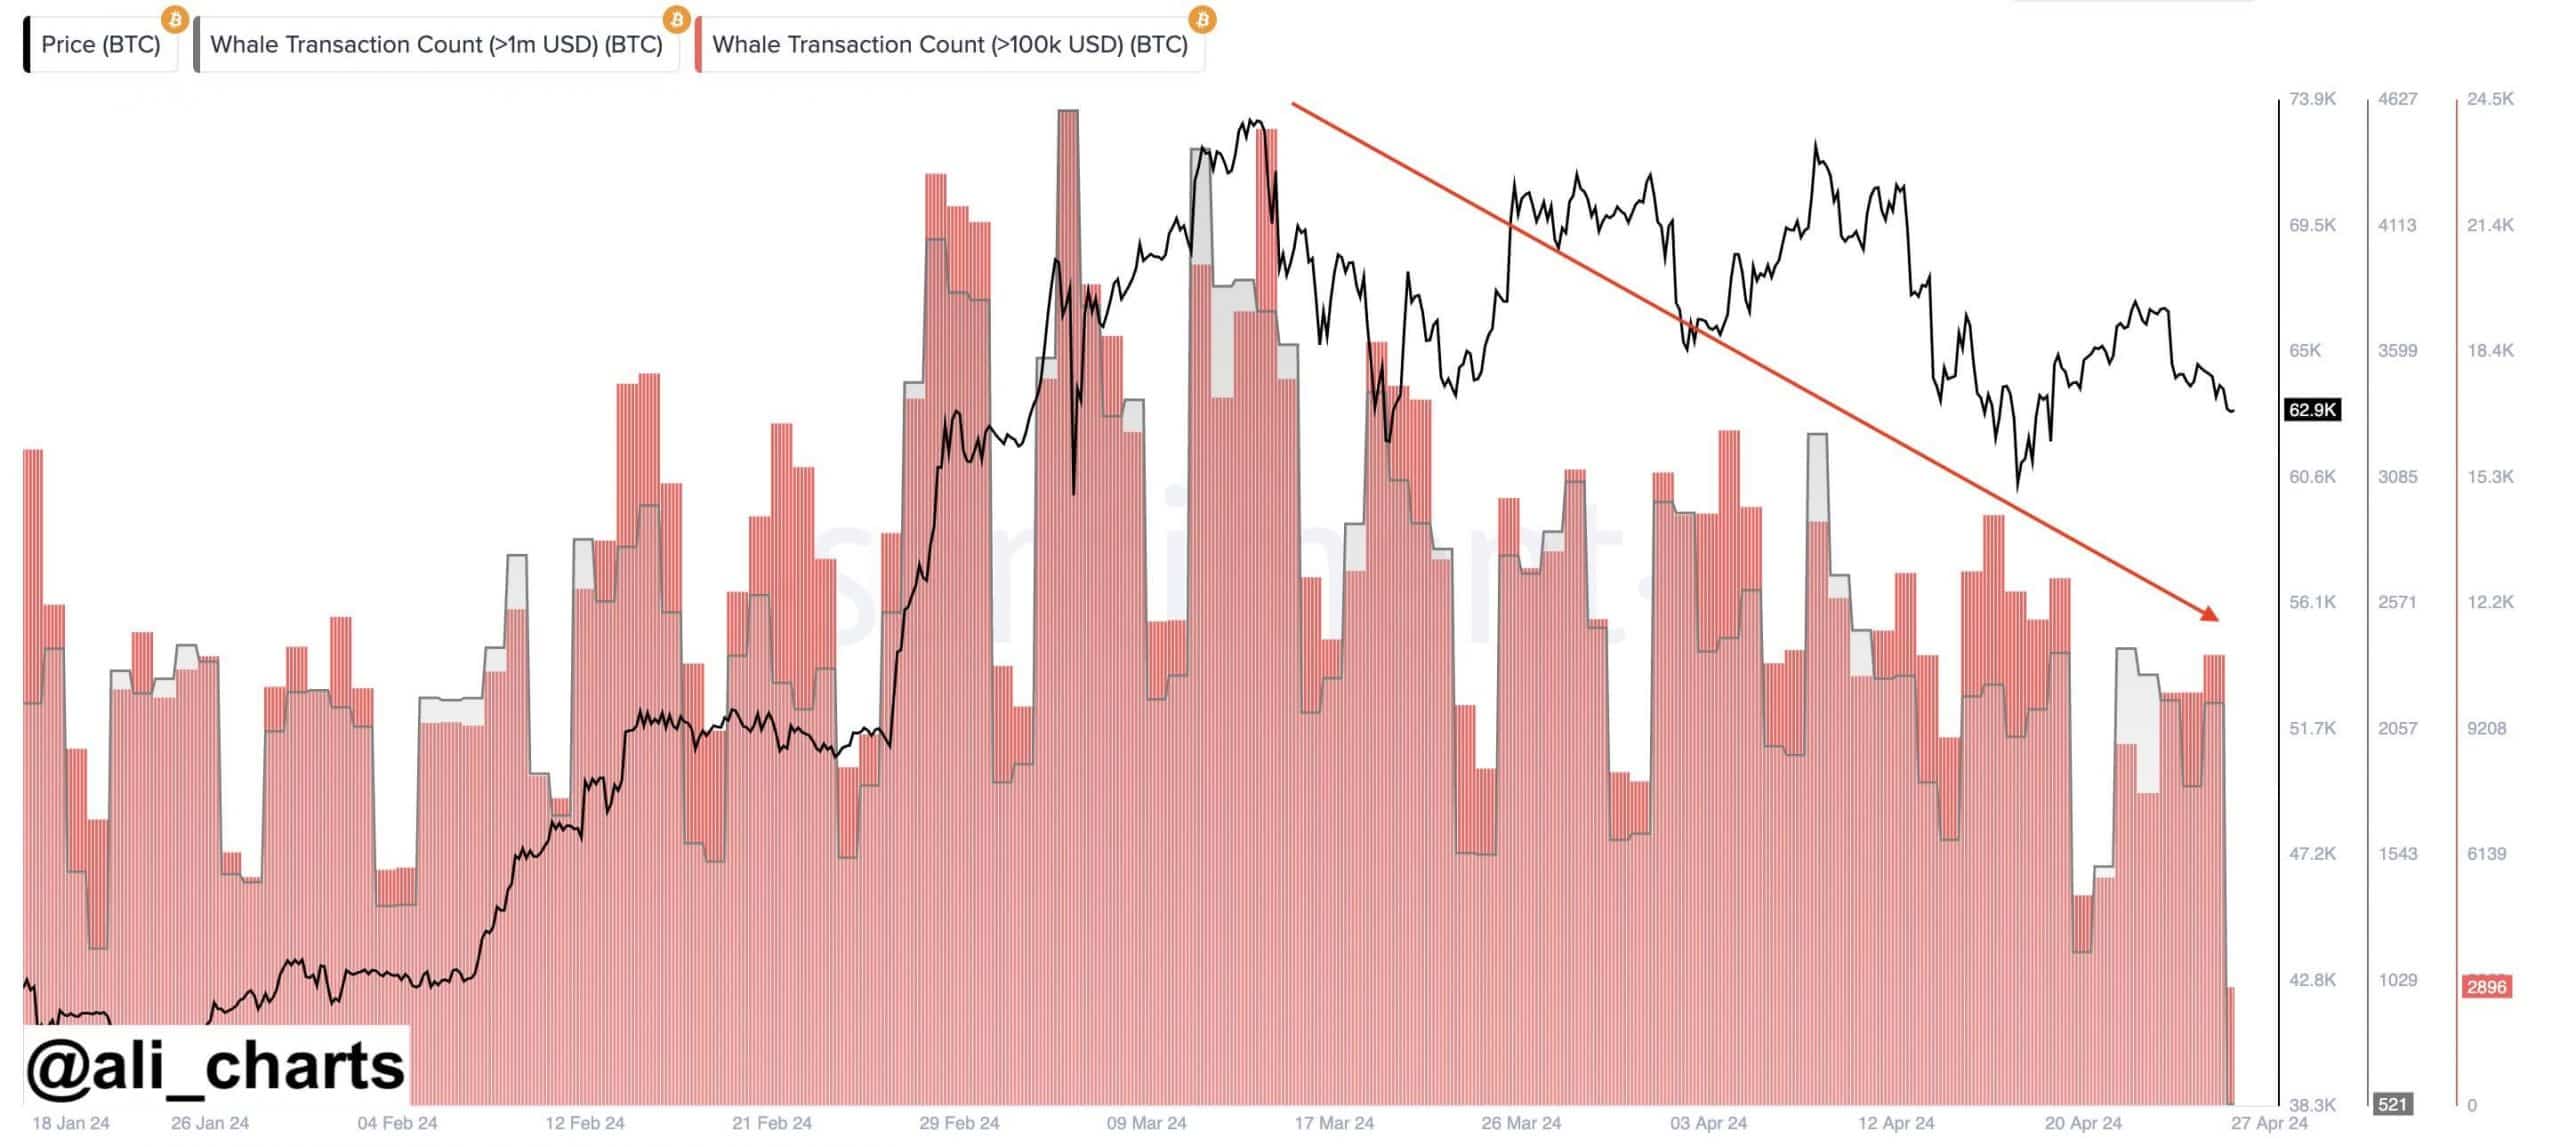
Source: Ali_charts on X
Crypto analyst Ali Martinez brought another interesting factor into the conversation. The whale transaction count has been in decline since mid-March.
The price of Bitcoin also lost its higher timeframe bullish impetus during the past month.
What do the futures markets reveal about Bitcoin market sentiment?
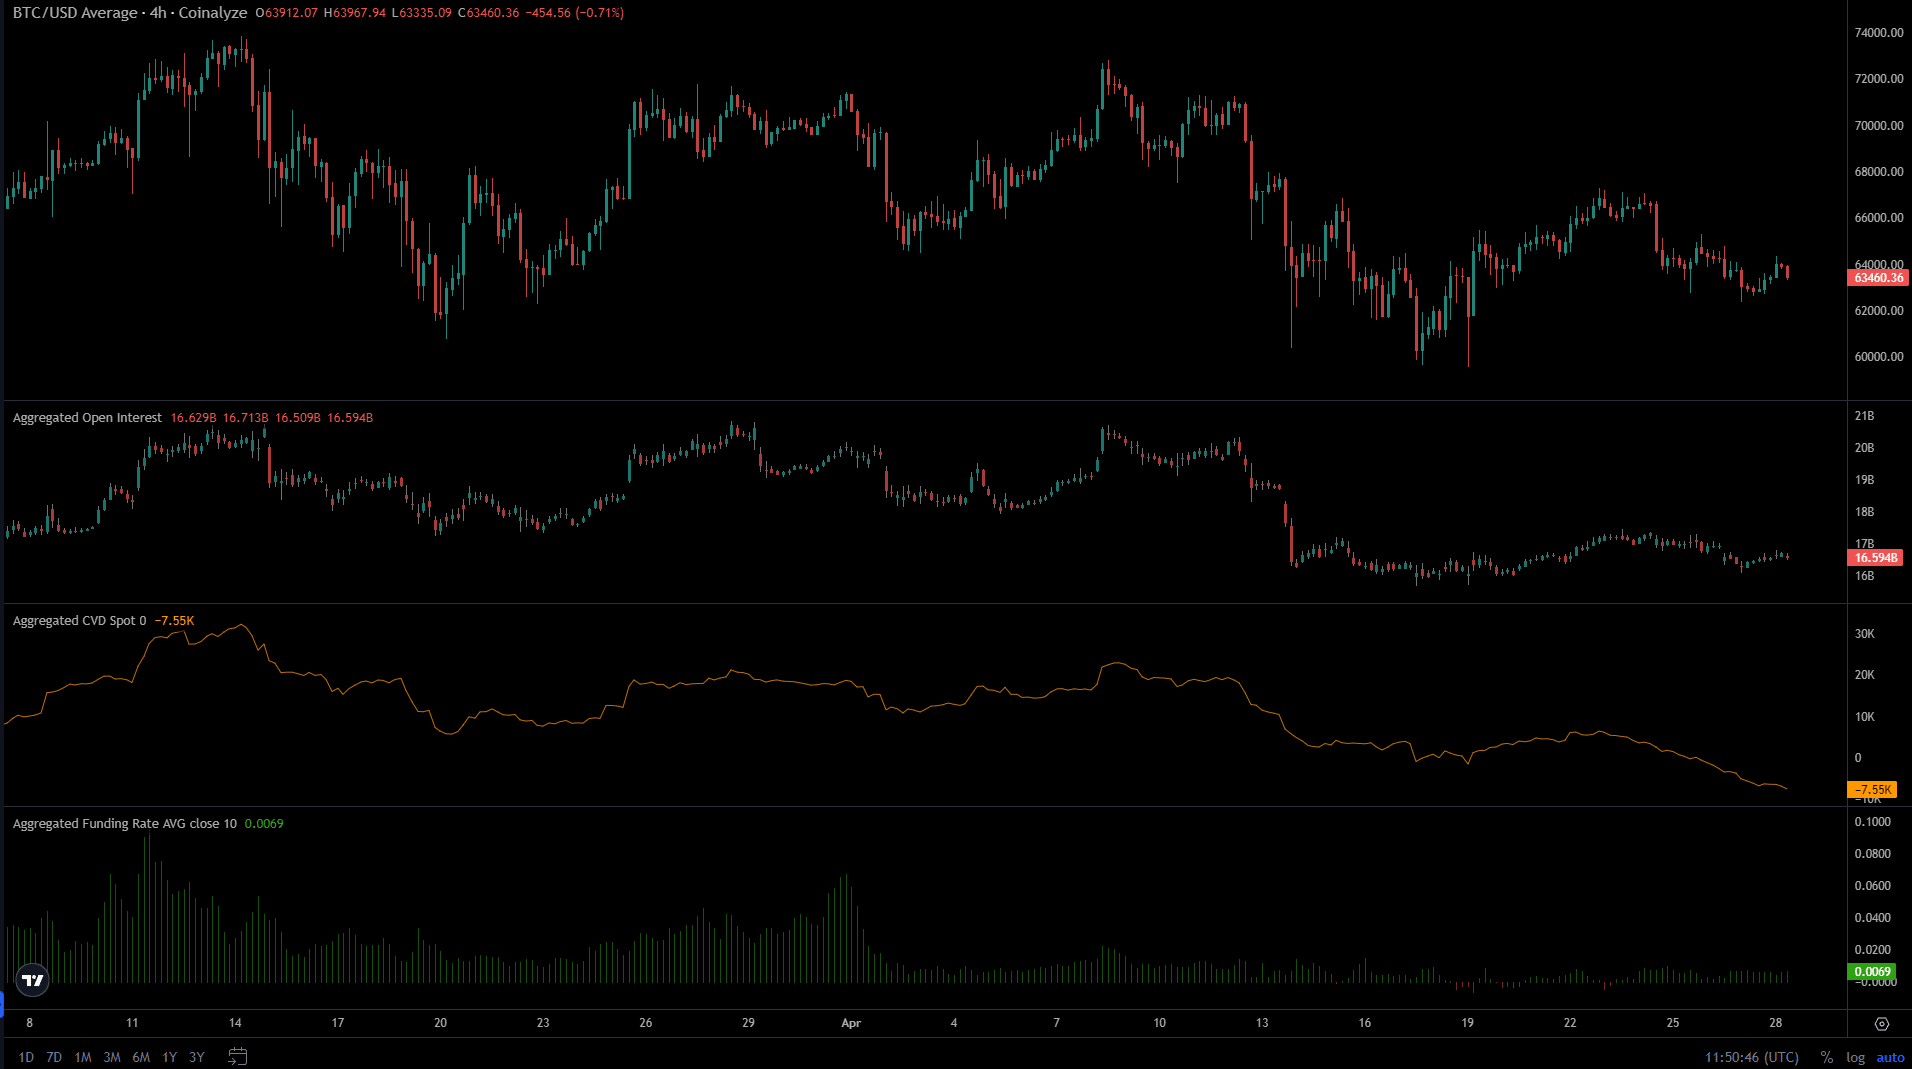
Source: Coinalyze
The Open Interest in Bitcoin has been waning since the 10th of April. This came alongside the price drop below $70k that took BTC to $60k and highlighted bearish sentiment. Speculators were unwilling to go long.
The Funding Rate, which had been very positive in March, was only just over zero in April, once again showing the speculator hesitancy.
The spot CVD climbed higher from 20th March to the 10th of April. This meant buyers were present in the spot market back then, giving price a reason to try to push above $70k.
In the past three weeks, it has been on a relentless downtrend. Therefore, it was likely that we would see BTC trend downward, or stay within a range.
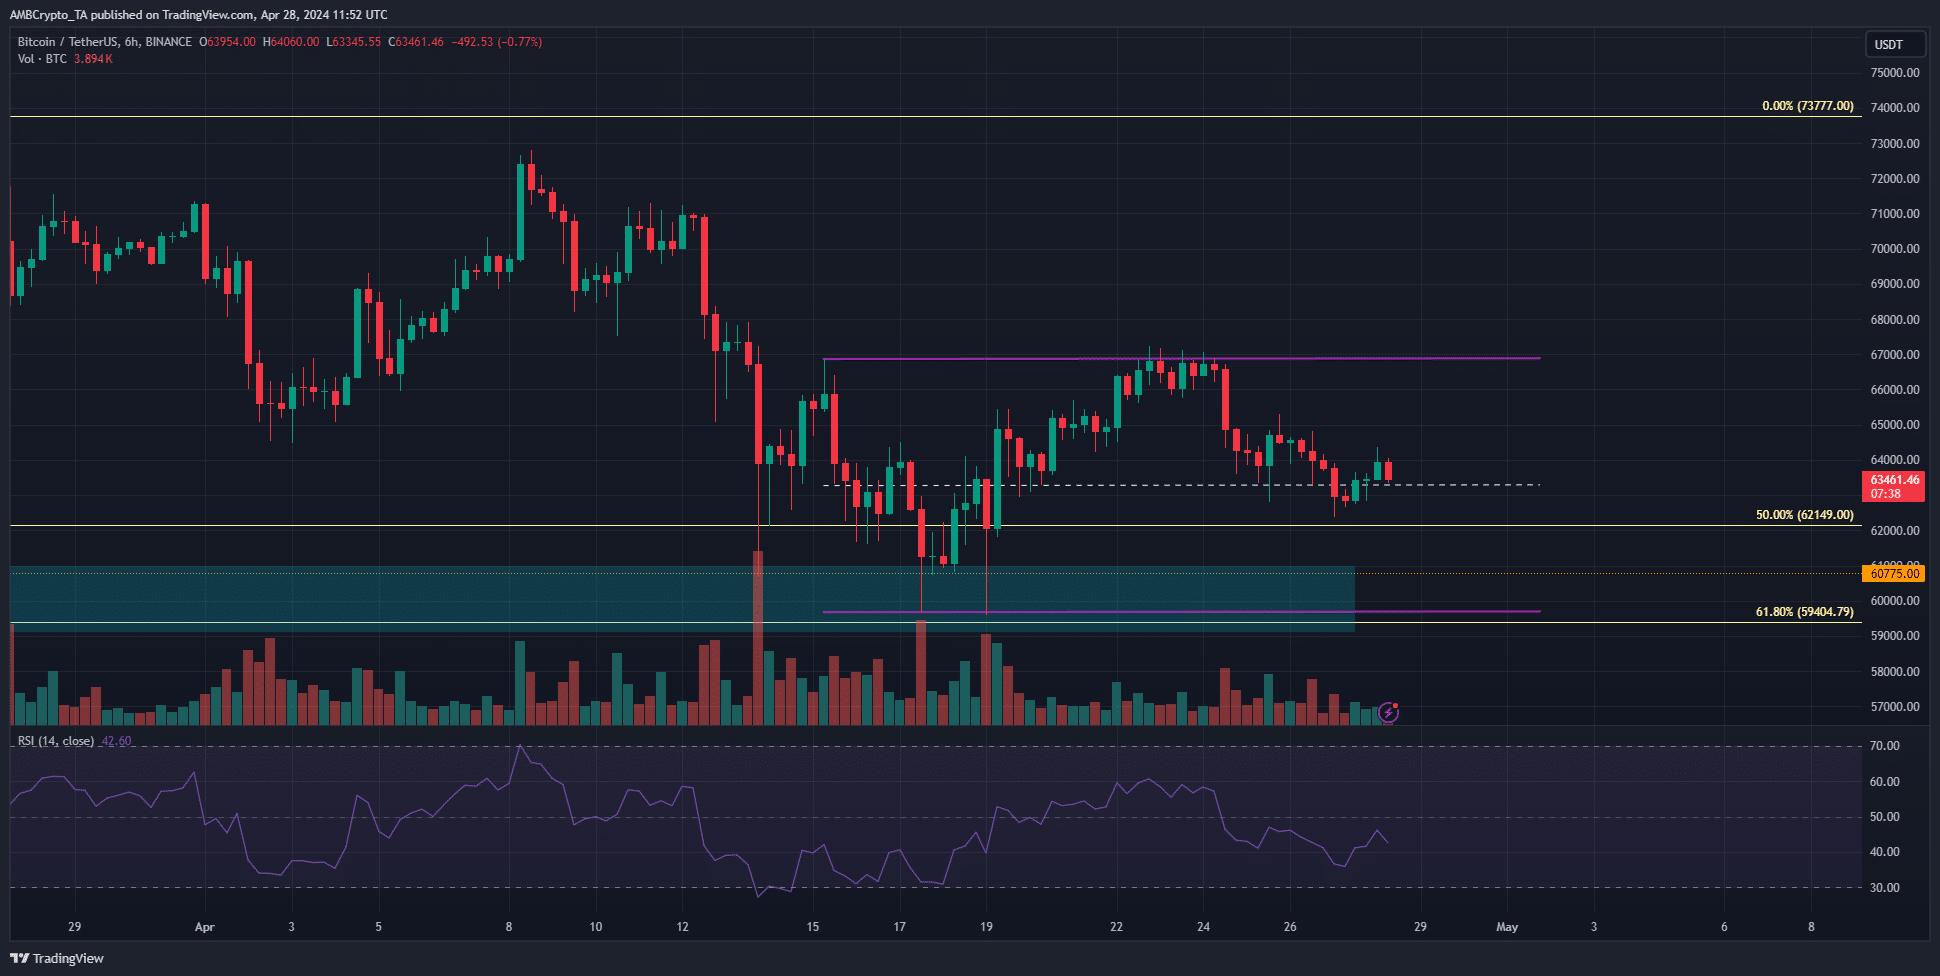
Source: BTC/USDT on TradingView
A short-term range between $66.9k and $59.7k (purple) was spotted. This was at the lower end of the $60k-$73k range that BTC was already trading within.
Is your portfolio green? Check out the BTC Profit Calculator
The mid-range mark at $63.3k was breached over the weekend, and we could see another drop to $60k later this week.
The RSI on the 6-hour chart was below neutral 50 and signaled bearish momentum. Combined with the lack of demand, it appeared likely that another downturn would soon be on us.