Bitcoin, Aave, Tron Price Analysis: 07 June

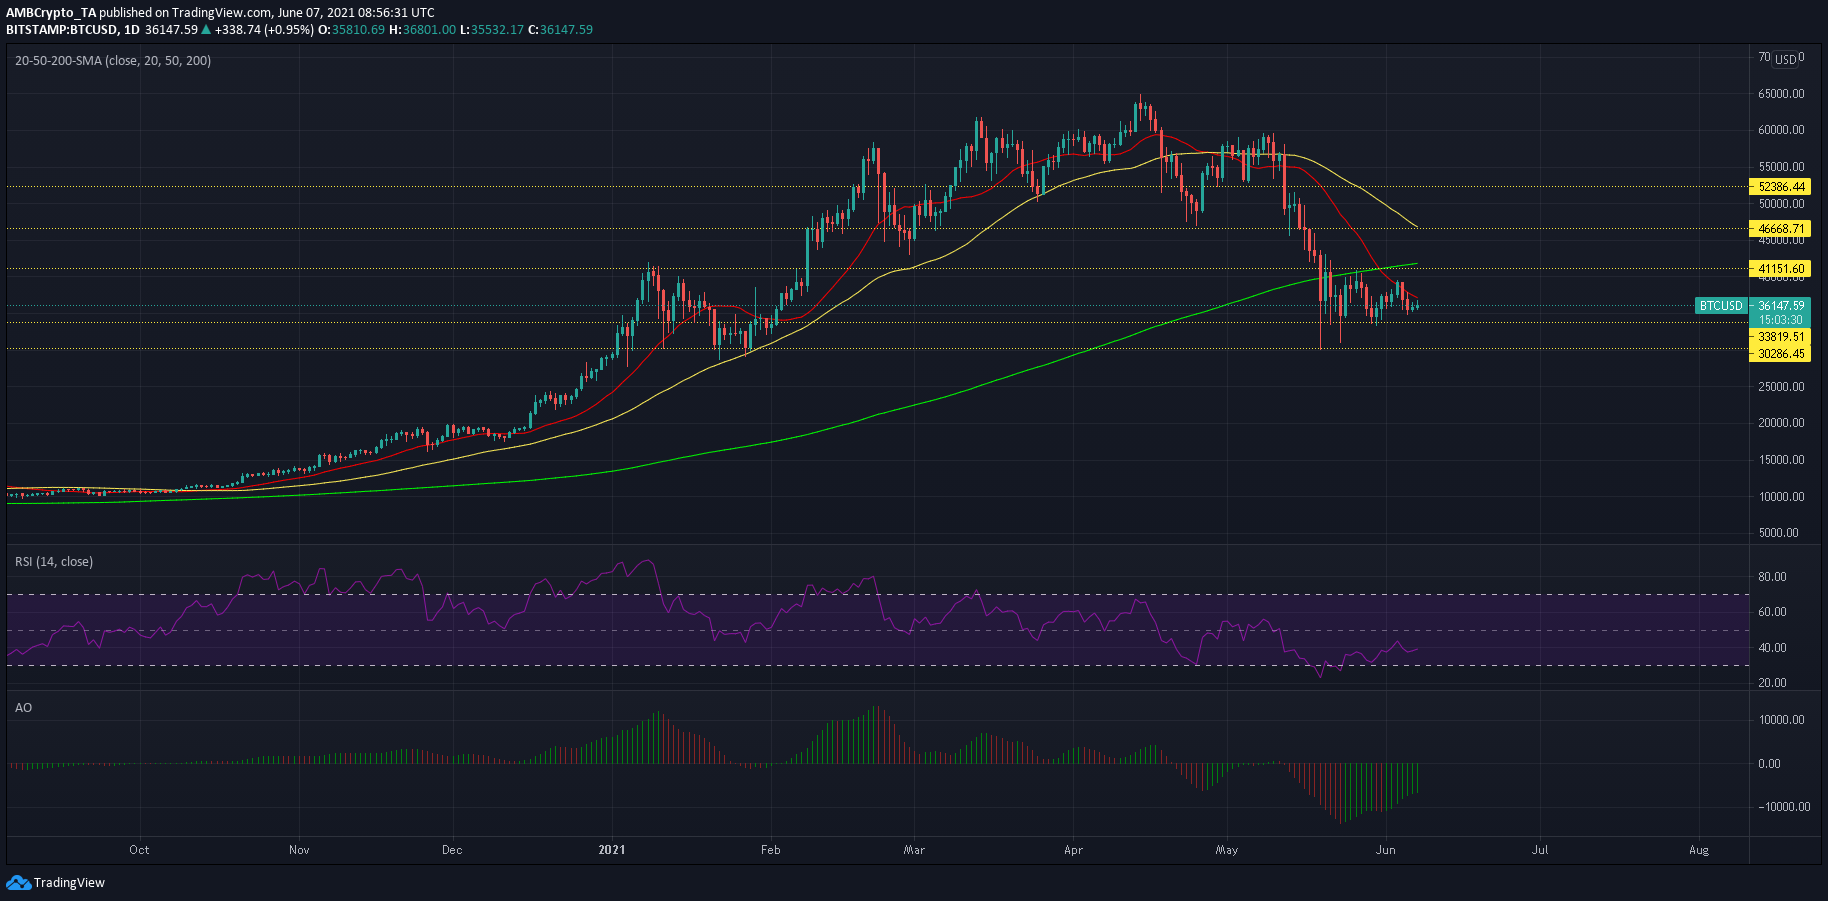
The king coin closed in on a death cross (crossover between 50-SMA and 200-SMA) and the same could result in a prolonged bear market. While alts such as Aave and Tron moved sideways and awaited stronger cues, bearish sentiment would likely drive them lower towards each of their respective demand zones.
Bitcoin [BTC]

Source: BTC/USD, TradingView
Bitcoin’s daily chart flashed some troubling signs for its mid-term trajectory. At the outset, BTC maintained its channel between $39,000 and $33,500 and it seemed like the market was fairly in balance between buyers and sellers. However, this state of equilibrium could soon be disrupted by a wave of bearish sentiment. BTC’s 50-SMA (yellow) closed in on the 200-SMA (green) and a death cross seemed imminent over the coming days. The last death cross took place in March 2020 when BTC fell as low as $3,850, and took nearly a month to recover above $10,000. If that were the case this time as well, we might be facing an extended bear market.
Even though RSI has managed to bounce back from the oversold zone, it still maintained bearish territory below 40. Bullish momentum has been building up on Awesome Oscillator but the same was still below half-line. Further bearish pressure would likely negate this momentum.
Aave [AAVE]

Source: AAVE/USD, TradingView
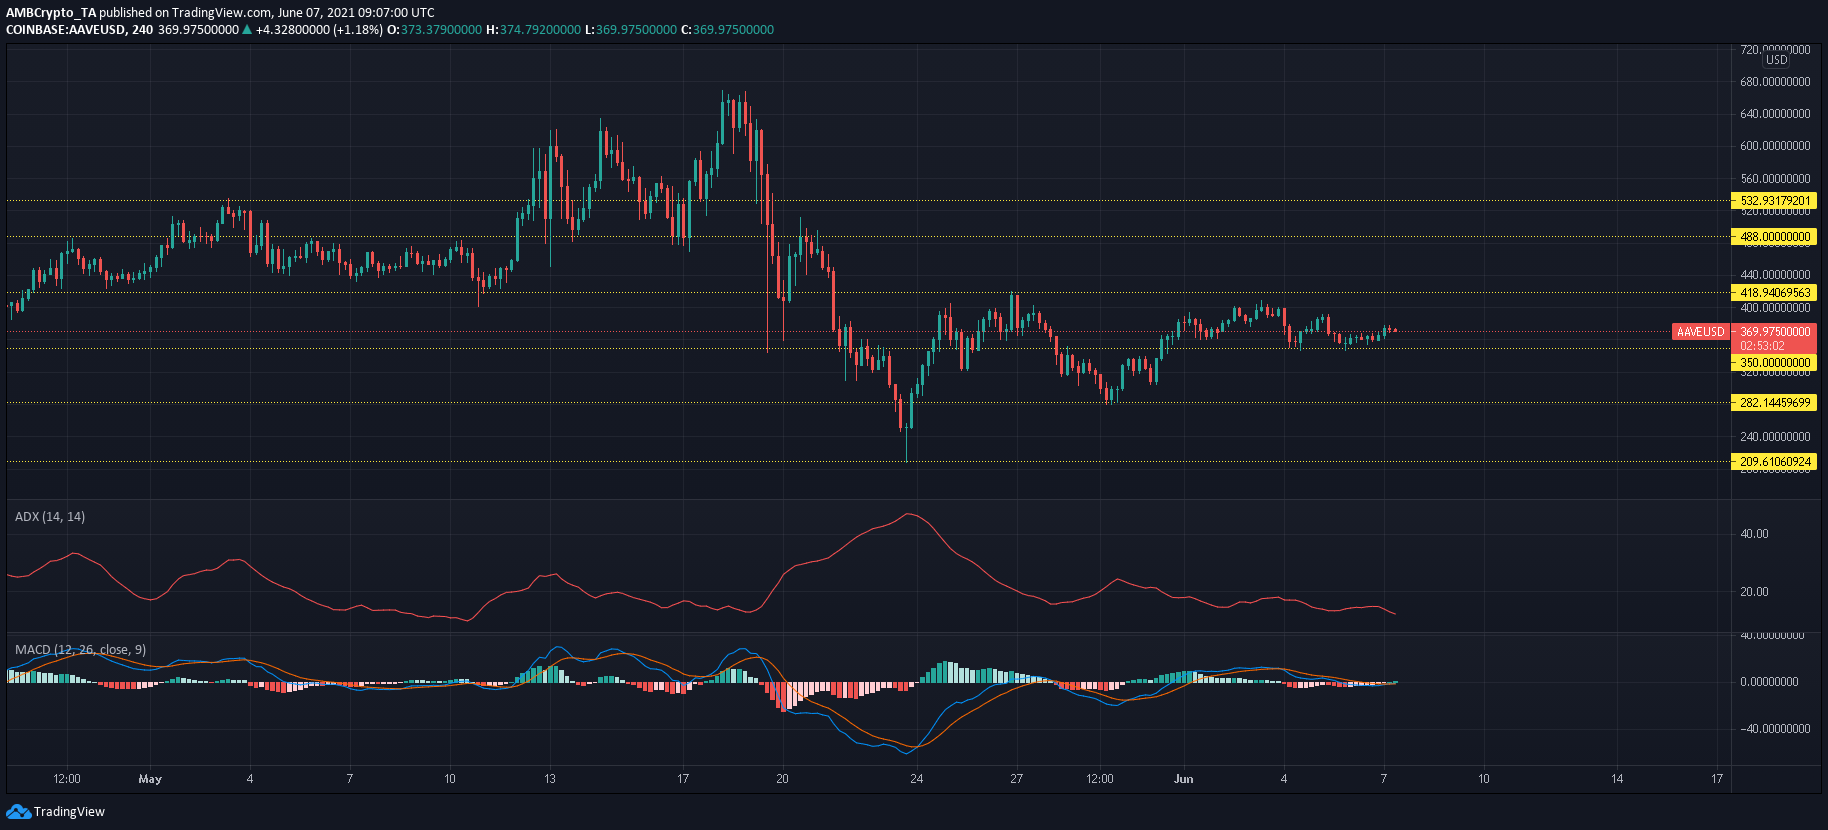
Aave was little changed over the last 24-hours but managed to post minor gains of 2%. Bulls defended $350-support and a 17% retracement to $282 seemed to be avoided. An ADX reading of 11 showed the lack of a strong trend and consolidation was likely within AAVE’s current channel. Once ADX picks up again, a breakdown could push AAVE as low as $209-support but broader market cues would likely dictate such movement.
MACD line was superimposed on Signal line as equilibrium was maintained between buyers and sellers at the time of writing.
Tron [TRX]

Source: TRX/USD, TradingView
Much like its counterpart Aave, no significant movements were noted in the Tron market as it traded within a tight channel of $0.068 and $0.085. Bollinger Bands showed little to no volatility and were constricted. However, this also meant that volatility would return once TRX ended its consolidation phase. A breakdown would see TRX head towards its demand zone between $0.050-0.057. Conversely, a breakout above $0.085 could trigger a 20% jump to $0.101- an area that coincided with 200-SMA (green)
According to Awesome Oscillator, momentum was bullish-neutral and no sharp price movements can be expected in the near term.

![Chainlink [LINK] price prediction - Watch out for a defense of THIS key level!](https://ambcrypto.com/wp-content/uploads/2025/04/Evans-17-min-400x240.png)


