Binance Coin Price Analysis: 07 June

Binance Coin has seen a good first half in 2021. Trading around $40 during December 2020, its price managed to snap record levels at $693 in May- representing a jump of 1,500% in just 5 months. During its meteoric rise, BNB positioned itself at the top of the crypto-ladder and has been in the top 5 rankings consistently. The 19 May crash may have stalled BNB’s upward trajectory, but the price has been making steady recoveries since the pullback.
BNB 4-hour chart
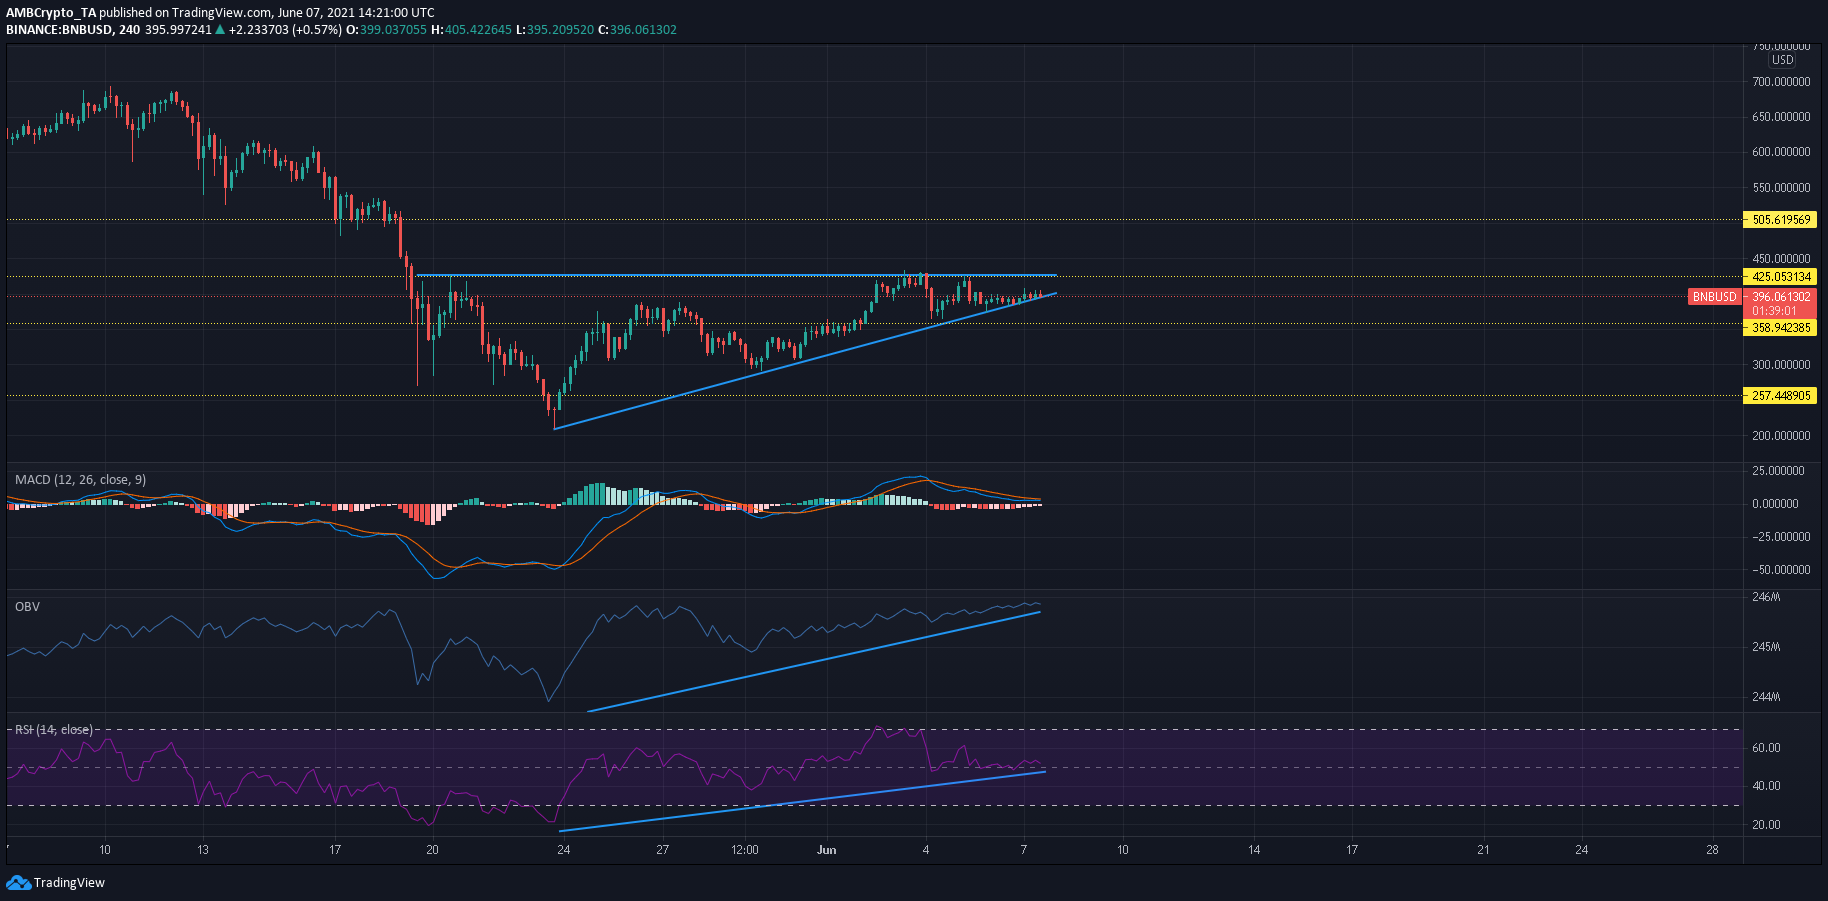
While a rapid buy phase on 2o May did push Binance Coin towards $420, selling pressure eventually took over and dragged the cryptocurrency to monthly lows of $210. This led to the emergence of a demand zone as BNB began its road to recovery. Although BNB has not been immune to regular market corrections, it managed to find support at higher levels- at $290, $370, and $390. The bottom sloping trendline indicated that the price has been forming higher lows- a positive development. An ascending triangle formed with the upper trendline representing resistance between $420 and $430.
Reasoning
Binance Coin traded within an ascending triangle- a pattern that usually sees a break to the upside. OBV’s higher lows showed that buying volume has been on the rise over the past two weeks. MACD approached a bullish crossover, while the histogram indicated declining bearish momentum.
Moreover, RSI’s uptrend confirmed with BNB’s price action. While these might not be signs of an immediate price swing, it did show that bulls were gaining control and preparing for the next upcycle. An important region to overtake lay around $430. This area offered support to BNB’s sharp pullback in mid-April and even triggered a 25% rally soon after. The same line was highlighted on multiple occasions post the 19 May crash as well. A successful breakout could open the doors for a 20% hike towards the $500-mark.
Crucial levels to watch out for:
Entry: $400
Take-profit: $500
Stop-loss: $360
Risk/Reward Ratio: 2.73
Conclusion
A bullish narrative has been building up in the Binance Coin market since 19 May. Overhead resistance between $420 and $430 has been tested on multiple occasions while the price has formed higher lows. An ascending triangle setup formed in the process and the technicals favored a break to the upside. Traders can exit their positions once BNB approaches the $500-mark- an area that coincided with the 50-SMA on a higher timeframe (daily chart).


