Bitcoin: An intact macro-bullish structure and what it means for rest of December

Bitcoin’s tussle with the $50,000-level has been ongoing for more than a week now. In fact, the recent flash crash under $45k reset BTC’s price to its early-October levels, pulling the asset down by over 15%.
Nonetheless, with the macro bullish structure still intact, here’s what it meant for the market’s top crypto.
Long-term goals remain the same
While 4 December’s price correction sent the larger market into “extreme fear,” whales and bigger investors like MicroStrategy kept buying the dip. In the aftermath of the fall, however, the HODLer buying trend softened, with Bitcoin noting a price pullback of 20%.
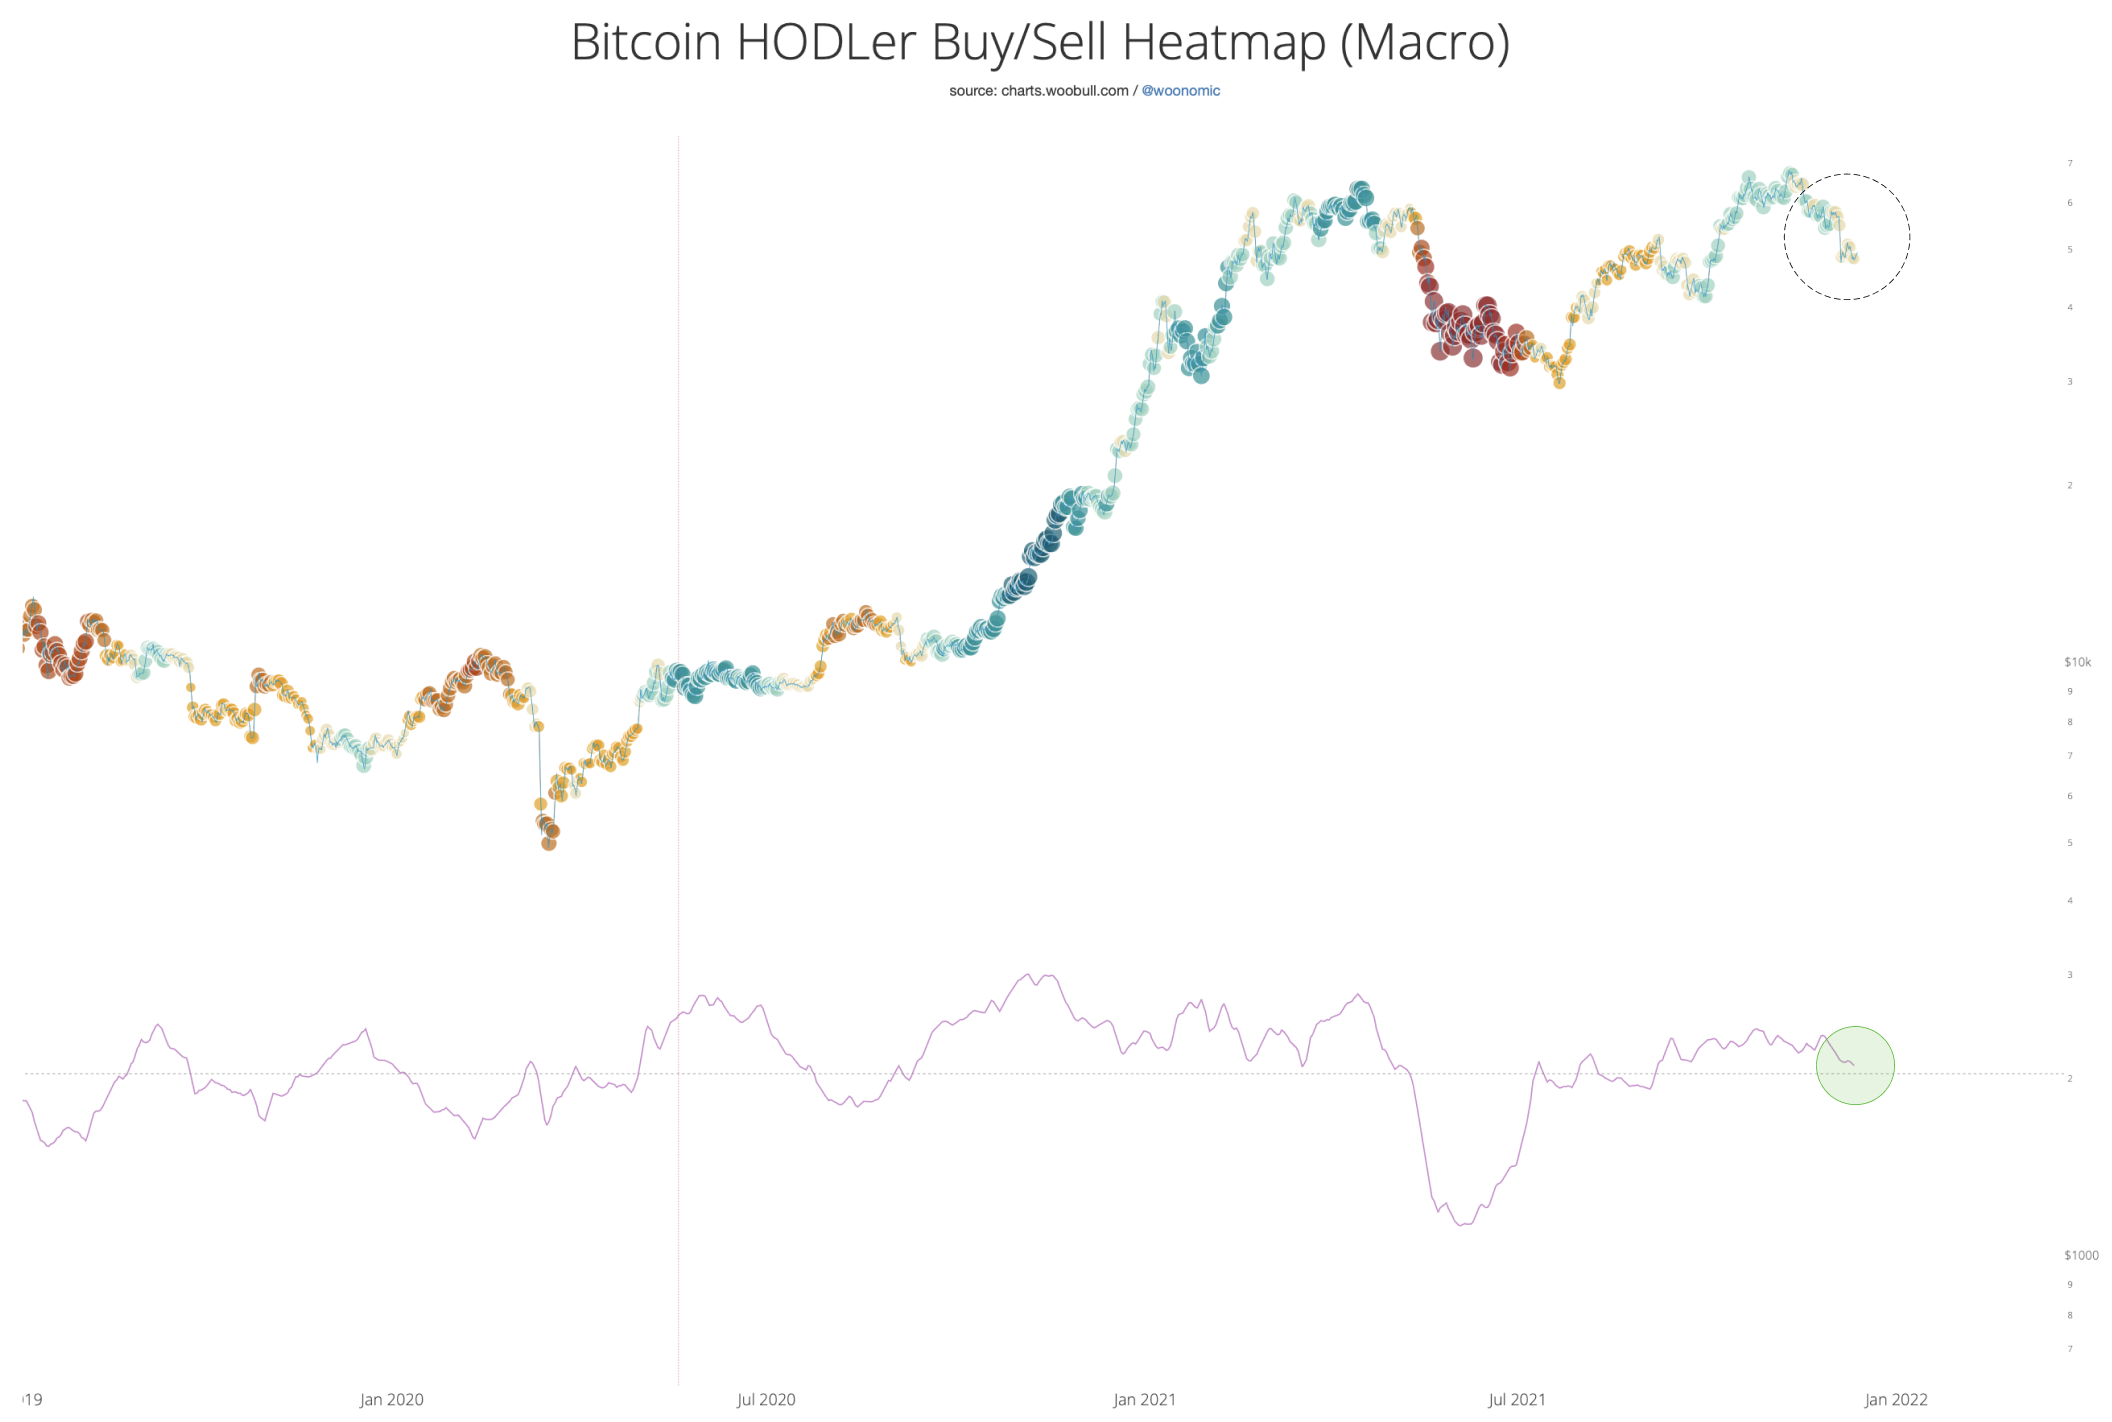
The net flow of coins moving towards HODLers remains in the bullish region, as seen in the heatmap below. Now, while accumulation has mellowed down, there haven’t been sufficient sell-offs to warrant a deeper bearish phase.
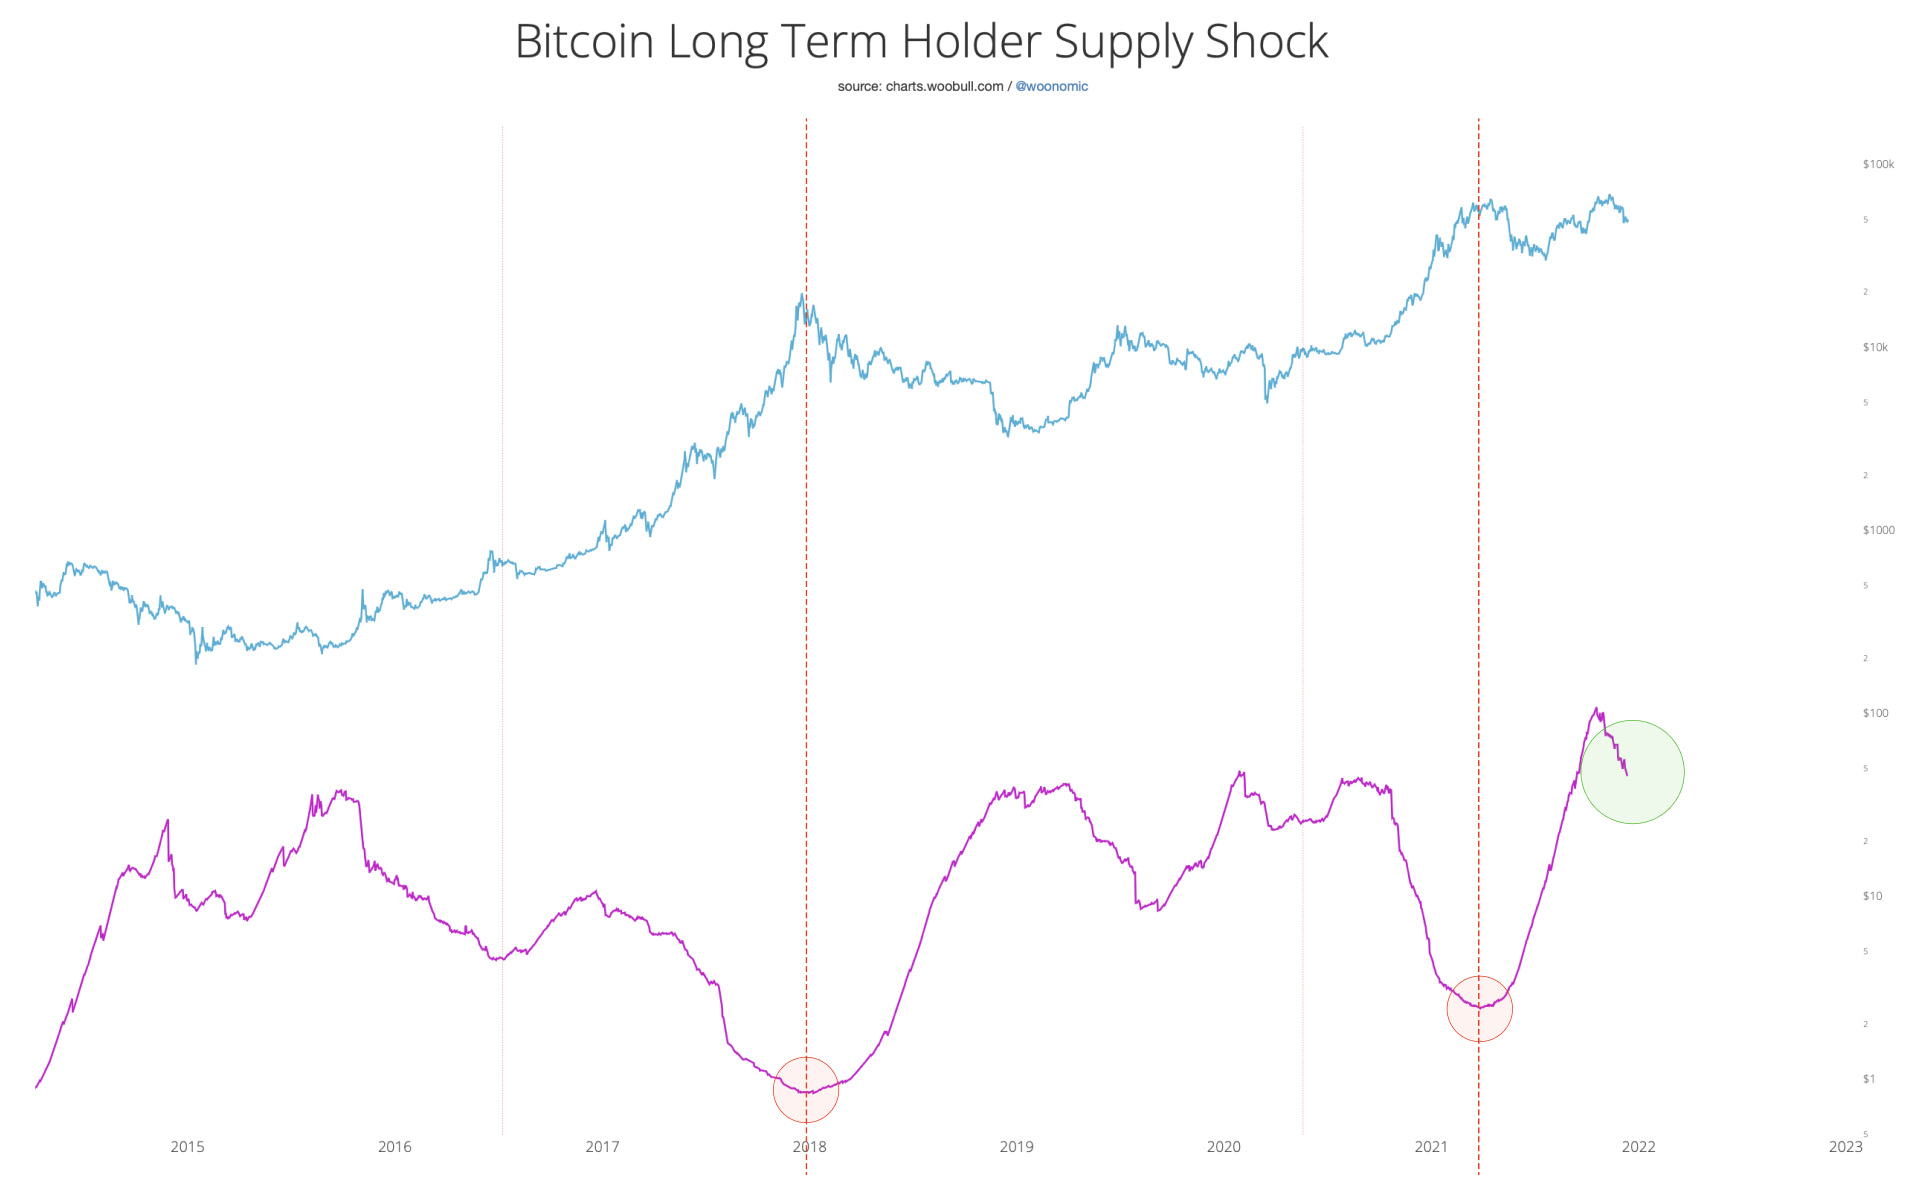
Long-term holders, on the other hand, still remain in a region of peak accumulation. Bear markets usually coincide with divestment by LTHs.
This time, however, despite the fear of another fall under the $45k-range, structurally, the setup for a bear market isn’t in place, as highlighted by analyst Willy Woo.
This is what BTC needs to get back into business
Structurally looking at BTC’s supply and demand, the long-term metrics still suggested a bullish or neutral setup. Short-term HODLers have been buying the dip, which might not have any short-term implications but act in favor of the top coin’s long-term narrative. Furthermore, coins have still been moving off exchanges.
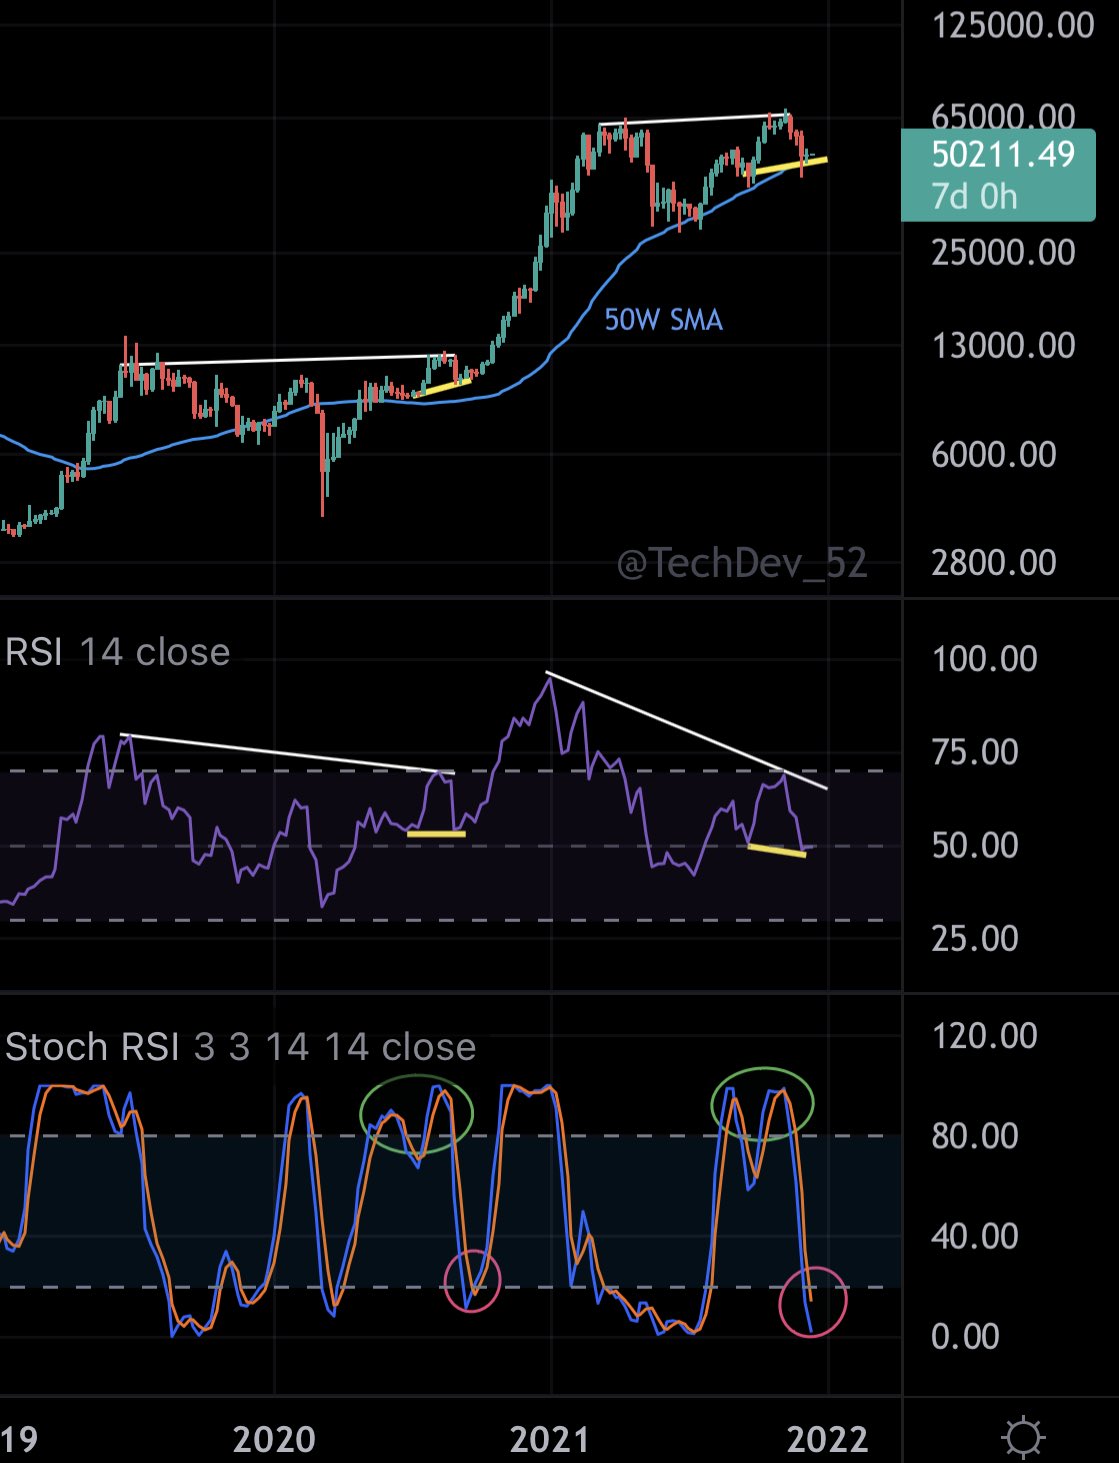
An interesting fractal pointed out by analyst TechDev noted the similarity in BTC weekly candles’ structure, as seen in 2020, before the first major leg and now. With the RSI making a double bottom and the Stochastic RSI seeing double tops followed by a bottom, the two structures seem to be eerily similar.
So, could BTC be prepping for another leg up? For Bitcoin to embark on a bullish trajectory yet again, it would first need to reclaim the $52k-$53k range. This long-term resistance is a bullish trendline, as well as the 21 weekly MA, and the 4-hour and 1 day MA’s EMA’s. Thus, establishing itself above this crucial level would be key to the momentum ahead.
While the month of December could bring price recovery from its recent lows, there could be further consolidation over the weeks.
All in all, while recovery could be in place with speculations of a Bitcoin bottom behind us, the rest of the year could see BTC’s price movements governed by volatility and external factors.


